GEOF337 student cruise: deploying moorings

We deploy two moorings in order to keep track of water exchanges over the sill; they will collect data for a year.  Instruments recording temperature, salinity, pressure, and velocity are attached to a rope, which is kept in place by an anchor and floating elements. One mooring is anchored on top of the sill (75m), whereas the other one is placed within the first basin at 460m depth.

The mooring is going over board. Train wheels are used as an anchor to keep it secured to the sea floor, the orange floatation spheres will keep it in an upright position while in the sea and bring the instruments back up to the surface when the mooring is released next year

This blogpost is one of a series written originally for our Insta-takeover of @PortalenIGLO, by the awesome night watch team Elina, Helene, Julie, and Sonja. Check out the twitter accounts of Elina and Sonja for updates on what they are doing when they are not at sea with us!

GEOF337 student cruise: About turbulence and how we measure it

The video showing milk being poured into water is an example of the small-scale process ‘turbulence’. In the ocean, turbulence is important for mixing of different water masses. We measure turbulence with a Micro Structure Sonde (MSS) by letting the instrument fall freely down the water column, recording temperature changes and water movement at a frequency of 1024Hz.

Algot and Arnt Petter are recovering the MSS after a successful measurement of turbulence in the fjord
Elina is working on the deck unit of the MSS, making sure everything is working well and data is recorded and saved

If you are interested in reading more about this, check out Mirjam’s blogposts on how to sample and how to measure dissolved oxygen! And a special post with focus on the color change of the indicator when titrating oxygen.

This blogpost is one of a series written originally for our Insta-takeover of @PortalenIGLO, by the awesome night watch team Elina, Helene, Julie, and Sonja. Check out the twitter accounts of Elina and Sonja for updates on what they are doing when they are not at sea with us!

Measuring dissolved oxygen at GEOF337 student cruise

In order to measure the oxygen levels, we lower down an instrument called CTD (as seen in the picture).

A CTD instrument on deck of Kristine Bonnevie, waiting to be deployed into the sea

The CTD measures conductivity (salinity), temperature and depth (pressure). It has grey plastic bottles attached to it, with which we can take water samples at different depths and analyze for oxygen content in the lab.

By adding chemicals to the water samples, we bind the oxygen so that we later can calculate the concentration through the titration technique.

Titrating an oxygen sample to measure the oxygen concentration

This blogpost is one of a series written originally for our Insta-takeover of @PortalenIGLO, by the awesome night watch team Elina, Helene, Julie, and Sonja. Check out the twitter accounts of Elina and Sonja for updates on what they are doing when they are not at sea with us!

Why we chose to go to Masfjorden for the GEOF337 student cruise

Masfjorden is 24km long, branching out from Fensfjorden. Masfjorden has three sills (a sill is an underwater barrier), which prevent the undisturbed water flow in and out of the fjord. This is why the oxygen levels near the sea floor are particularly low, limiting the marine life as well as decomposition processes. To get new oxygenated water into the basins, dense Atlantic water needs to flow over the sill – this does not happen very often! This week we will study the Masfjorden water masses through a series of measurements.

Map of the bathymetry of Masfjorden and Fensfjorden. The deepest parts are yellow, the shallowest parts are blue.

This blogpost is one of a series written originally for our Insta-takeover of @PortalenIGLO, by the awesome night watch team Elina, Helene, Julie, and Sonja. Check out the twitter accounts of Elina and Sonja for updates on what they are doing when they are not at sea with us!

GEOF337 Student cruise to Masfjorden

This blogpost is one of a series written originally for our Insta-takeover of @PortalenIGLO, by the awesome night watch team Elina, Helene, Julie, and Sonja. Check out the twitter accounts of Elina and Sonja for updates on what they are doing when they are not at sea with us!

Ahoy from Masfjorden!

This week we are a group of UiB students going on a cruise, and we are taking over the #portalenIGLO. The ship is called Kristine Bonnevie and is one of IMR’s research vessels. Our study area is mainly Masfjorden, but we are also taking some samples from Fensfjorden, both a five hour journey north of Bergen. This week we will show you what we typically are doing on a fjord-oceanography cruise.

The Masfjorden 2019 crew

Treasure hunting in Antarctica!

Yesterday the weather finally allowed the technicians from the Nowegian Polar Institute (NPI) to leave the research station Troll and fly out to go treasure hunting on the Fimbull ice shelf! Two years has gone by since they last visited the sites where NPI installed sub-ice shelf moorings more than ten years ago… and where we two years ago installed an “ApRES”. While the sub-ice shelf moorings measure the temperature and the currents in the water beneath the ice shelf, the APRES measures how fast the ice thins, and we can then calculate the basal melt rate. When combining the records we can hopefully learn a lot!

Like most Places in Antarctica, the snow that falls on the Fimbull iceshelf never melts away, so there was a few meters of snow to dig through in order to reach the instruments and to download the oh so precious data – a true treasure hunt!

Judging from the photos, the solar panel system that Helge Bryhni, a technician here at GFI, helped me design in order to power my APRES,  appear to have survived two Antarctic winters… and we are now eagerly waiting for the report on how they’ve performed… and to have a look at the new data!

More stories from the successful treasure hunt at the Fimbul ice shelf will appear at @oceanseaicenpi soon!

The Twinotter has landed at site M2, Fimbullisen. Our solar panels are sticking up from the snow! Photo: Sven Lidström, NPI
Lots of showels, lots of digging to be done… Photo: Sven Lidström, NPI
The yellow APRES Box was buried beneath a few meters of accumulated snow. Photo: Sven Lidström, NPI


Funded!

The Santa Claus at the Norwegian Research Council distributes his gifts already during the first weeks of December… and this year one of them landed on our desk! Our Project  iMelt (which is short for “Ocean-ice shelf Interaction and channelized Melting in Dronning Maud Land”) led by Laura de Steur at NPI got funded!

10 MNoK to service moorings and installations on the Fimbull ice shelf, to hire a PhD-student and posdocs to analyse all the data we are and will be collecting and to numerically model the system we are studying 🙂

This is the Project summary form the Application:

The recent increase in the Antarctic contribution to global sea-level rise is a major concern given that the majority of the world’s population lives along the coastlines. This increase, which is now thought to be irreversible in West Antarctica, is triggered by ocean-induced melting beneath the floating parts of the ice sheet known as ice shelves. Most basal melting occur near the ice-sheet grounding lines and the ice-shelf fronts, as well as within basal channels underneath the ice shelves. This project will quantify the processes and importance of ocean-ice shelf interactions and channelized basal melting in Dronning Maud Land, East Antarctica. The main focus will be on Fimbulisen ice shelf which has a complex network of basal channels in the central part of the ice shelf and a tongue that extends seaward of the continental shelf. Under-ice shelf data has been collected at Fimbulisen since 2010 and new, planned infrastructure along the coast of Dronning Maud Land will allow us to investigate ocean processes outside the ice shelf. Three autonomous radars are also deployed on Fimbulisen and Nivlisen ice shelves to monitor ice-shelf basal melting directly. The Project will quantify the relationship between far-field ocean dynamics, ocean-ice interactions and basal melt rates through these concurrent oceanographic and under-ice shelf measurements. This interdisciplinary research combines in-situ measurements, satellite remote sensing, and high-resolution modeling of ice-ocean interaction in Dronning Maud Land and will provide fundamental new knowledge on processes related to basal melting, essential for a better understanding of the stability of the Antarctic ice sheet.

… and this is the Fimbull ice shelf!


Dead water

 (by: Torunn Sandven Sagen, Petter Ekrem, Eirik Nordgård)

In 1893, during the Fram expedition, Fridtjof Nansen and his crew encountered a phenomenon where the velocity of the ship was reduced significantly, even though the engine was working at full speed. Nansen described this phenomenon as “dead water” (Brady, 2014). This dead water effect can happen when the ship creates an internal wave as it moves through water. The water must be stratified, meaning that the top layer is less dense than the bottom layer. At the same time, the draught of the ship must have the same depth as the top layer. The internal wave produces a drag, reducing the velocity of the ship. The speed of the wave is only dependent of densities and depth of the layers, not the velocity of the ship. (Grue, 2018).

We performed an experiment (as seen in the video) where we recreated the ocean conditions and created an internal wave. Then we explored how and when the internal wave could influence the velocity of the ship. To simulate the conditions Nansen experienced, a wooden boat was pulled with constant force across a tank filled with water. The water had two layers, one fresh layer on top (clear), and one saline underneath (purple). The depth of the saline layer must be much greater than the depth of the fresh layer.

The experiment was performed several times with the boat being pulled with constant, but different, force. We expect that if the speed of the boat is larger than the speed of the internal wave, the boat will not feel the wave because it moves faster than the internal wave. If the speed of the boat is smaller than the speed of the internal wave (as seen in the video), the wave will catch up with the boat, and the speed of the boat will be much reduced.

Hydraulic jump

(by Cristina Arumi Planas, Elise Madeleine Colette Brunet, Haley Okun)

In order to observe Lee Waves and their related phenomenon, an experiment was conducted in a large water tank with a stratified two layer system. The two layer system was constructed with fresh water sitting atop colder salt water. The fresh water had a salinity of about 0‰, with a density of 1000 kg/m3 while the pink-dyed salt water had a salinity of about 35‰, and a density of 1028 kg/m3. In order to force Lee Waves to propagate, a mountain was moved along the bottom at two different speeds, fast and slow. While conducting an experiment to visualize Lee Waves, the phenomenon of the hydraulic jump can be observed. This event can be visualized when water flows over rocks or even in one’s kitchen sink. This occurs when water flowing over a surface goes from subcritical to supercritical, which is calculated through the Froude number. To calculate this, the velocity of the flow is divided by the phase speed of the shallow water gravity waves. The square root of this fraction is then taken to provide a unitless value called the Froude number. The result is either greater than one (supercritical) or less than one (subcritical). Supercritical Froude numbers indicate that waves cannot propagate upstream. This can physically be visualized when the flow over the observed surface goes from smooth and rather thin, to turbulent and rough. As we pushed the mountains through the stratified water, the denser saltwater (shown with pink dye) was forced up and over the mountain, resulting in turbulent motion just behind the surface anomaly. As the thinner flowing water moved from the downhill slope of the mountain to just downstream and onto the bottom of the tank, the flow went from smooth to rather chaotic. The interface where the flow becomes turbulent is the hydraulic jump. The smoother water flowing over the mountain is supercritical while the more mixed water just downstream is the subcritical flow. When the mountain was moved at the faster speed, this hydraulic jump was shifted accordingly. Instead of the hydraulic jump occurring just behind the mountain, the waves seemed to lag with the more turbulent flow occurring farther downstream than with the slower mountain speed.

To build or not to build, that is the question

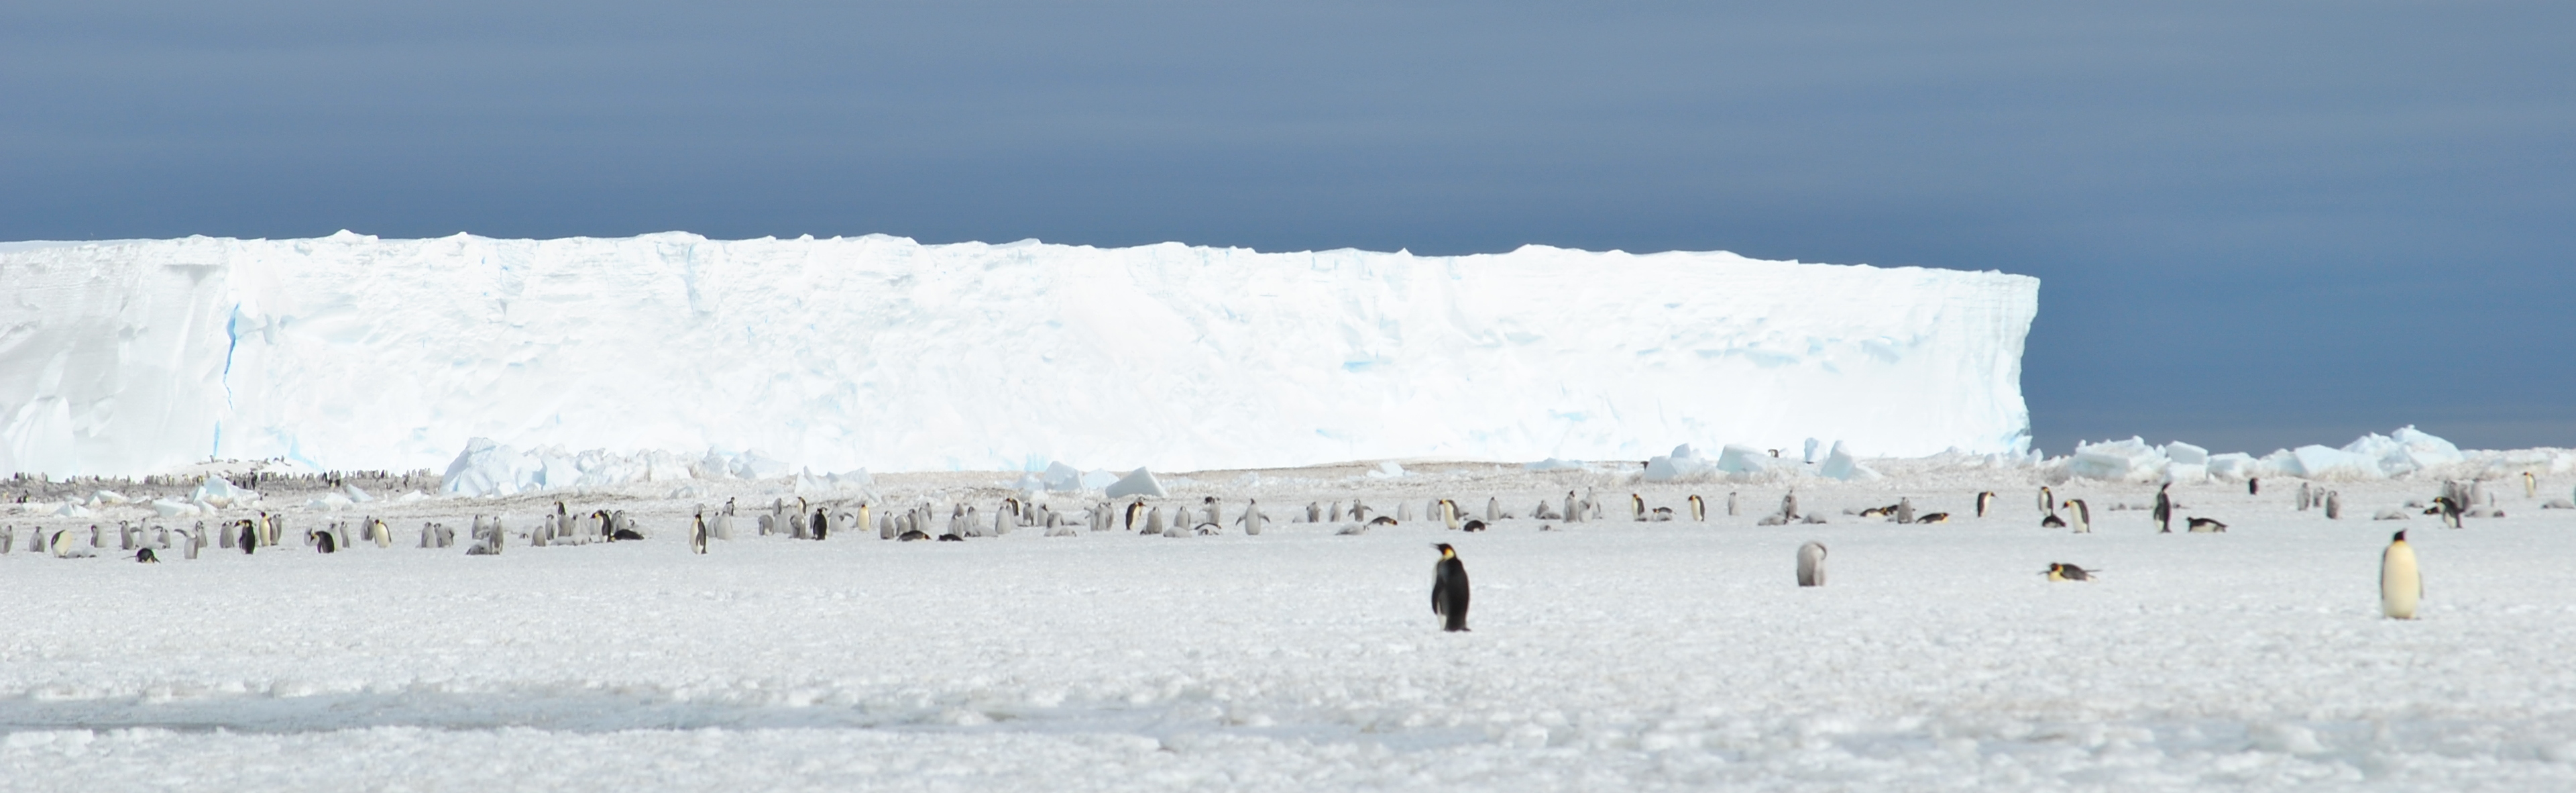
Antarctic ice shelves are thinnening at an accelerating rate, and they do so because oceanic currents bring warm water (heat) into their cavities causing them to melt from below. When they melt away, the ice sheet upstream accelerates, ice (mass) is moved from land to the ocean and the sea level rises, threatening to flood vast and densely populated areas. A part from cutting down our CO2 emissions there’s nothing we can do about it, or is there? We can off course build walls, or dikes, to keep the rising seas out like they do in Holland, but what if we built a wall that stopped (or at least slowed it down) the sea from rising?

Recently scientists from Princeton and Bejing Normal University suggested in the Cryosphere that in order to put  off a potential collapse of e.g. Thwaites ice shelf (which is thought to be unstable and which is feed by a huge, marine based ice stream and thus has a potentially large impact on the sea level) further into the future we should simply build a large wall – not in Holland, but at the seafloor in Antarctica, in order to block the warm water and keep it from entering the ice shelf cavity. It sounds like science fiction – and the thought of constructing such a wall is more frightening than anything Hollywood can produce. The risks are huge, the environmental impact is enormous (and thats sort of the point of it) – but the consequences of not doing it may be likewise. Enormous areas would be flooded, millions of people would have to leave their homes as the sea keeps rising. A wall would only buy us time, it would postphone, not stop, what is happening around Antarctica. And it would have no effect at all on other consequences of global warming. We still need to cut down our emissions, sooner rather than later, to make sure that our children and grandchildren – and their children and grandchildren – can live on the planet we call home.

So, if to build or not to build is the question, what would be your answer?

I was interviewed by a journalist from Ekko, a Norwegian radio program, about the proposed wall and the melting Antarctic ice last week. You can listen to the program here (in Norwegian/Svorsk). I’m right at the end!