Today I’ve been listening in on the COSMUS cruise-planning meeting at AWI in Bremerhafen – it’s been great to hear all the groups that are joining the cruise tell about the exciting research that they are planning! During 75 days – no that’s not a typo, 75 days or almost eleven weeks* – at sea, physical oceanographers, sea-ice physicists, all sorts of biologists and bio-geo-chemists will live and work onboard Polarstern – and people will do so many cool things! There will be bottom landers that measures the oxygen consumption of benthic fauna, bottom crawlers that map the ocean floor at millimeter precision, microplastic filtering, profiling with high cameras to quantify the amount of sinking organic matter… and off course plenty of good old CTDs and moorings! There will also be seal tagging, and I was excited to see my name in the group of people that gets to go on the ice and actually meet the beasts up close!
I joined Polarstern on a cruise in 2005, when I’d just started on my PhD. I bet many things will have changed – but rumours has it that “Zillertal” (the small bar) is still around!
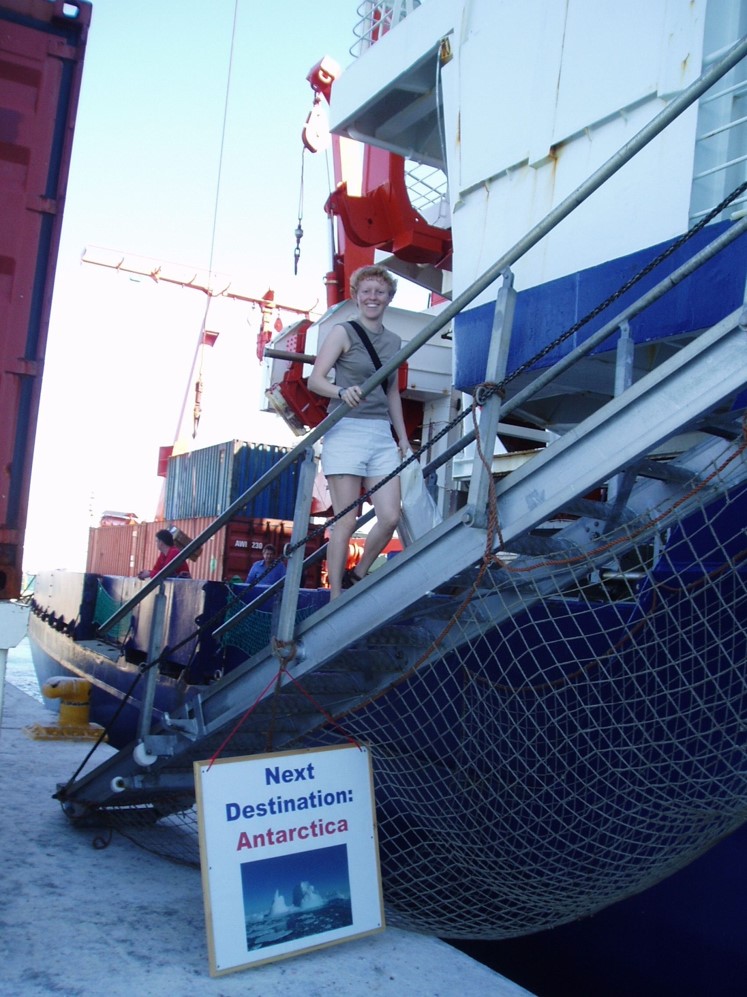
Joining Polarstern in Cape Town for my first Antarctic cruise in 2004. In 2021 I’ll do it once again.
*I didn’t tell my husband yet that the cruise will be that long, not quite sure about how to break the news… I’ve been told to tell things like that when there are lots of people around – and preferably nice food on the table… but I’m not sure about that one!
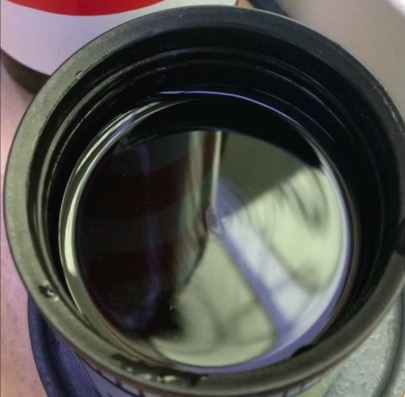
Congratulations to @MarkusMelin4 and @cisprague who has recovered four out of four moorings in the Amundsen Sea! Despite fishing vessel rescue-operations, iceberg-on-top-of-mooring-problems and strong winds the four moorings and all of the instrumentation are now safely on deck! One of the top boys had suffered from an iceberg encounter and the connector plug on my ADCP (A large instrument that measures the current velocity in the water column using acoustics and Doppler theory) had been leaking…. but that’s just little scratches when you consider that they’ve spent two years in the water!
I look forward to see what the records has to tell us about the currents and the hydrography around the Getz ice shelf. Stay tuned!
Uff – seawater can do horrible things to instruments. Luckily it can be repaired! Photo: Markus Melin
Kjersti, Steffi, Elin and myself (Mirjam) recently discussed ways to better integrate the GEOF105 student cruise into the course. My suggestion was to ask the students to observe things throughout the whole duration of the course, and then have them relate their time series with what they observe when “at sea”. In this mini series tagged #BergenWaveWatching, I write up a couple of suggestions I have for observations that are easy and fun to make. I am anticipating that my suggestions will be strongly biased towards #wavewatching, so if you have any other suggestions, I am all ears! 🙂
Where to go
We spotted standing waves in a bucket on the latest GEOF105 student cruise, but in addition to on ships, they can also be spotted for example on trains (see pic below), in cars, or even on washing machines.
What to look out for
The pattern that form on the surface of vibrating fluids
What to do with the data
Describe the pattern and try to understand why it looks the way it does (like I did here). Is it the frequency of vibration? The shape of the vessel? The material of the vessel? The location relative to the source of vibration?
Do you have suggestions for us? What other spots or topics would you recommend in and around Bergen to be added to the #BergenWaveWatching list? Please leave a comment! We are always looking to expand this list!
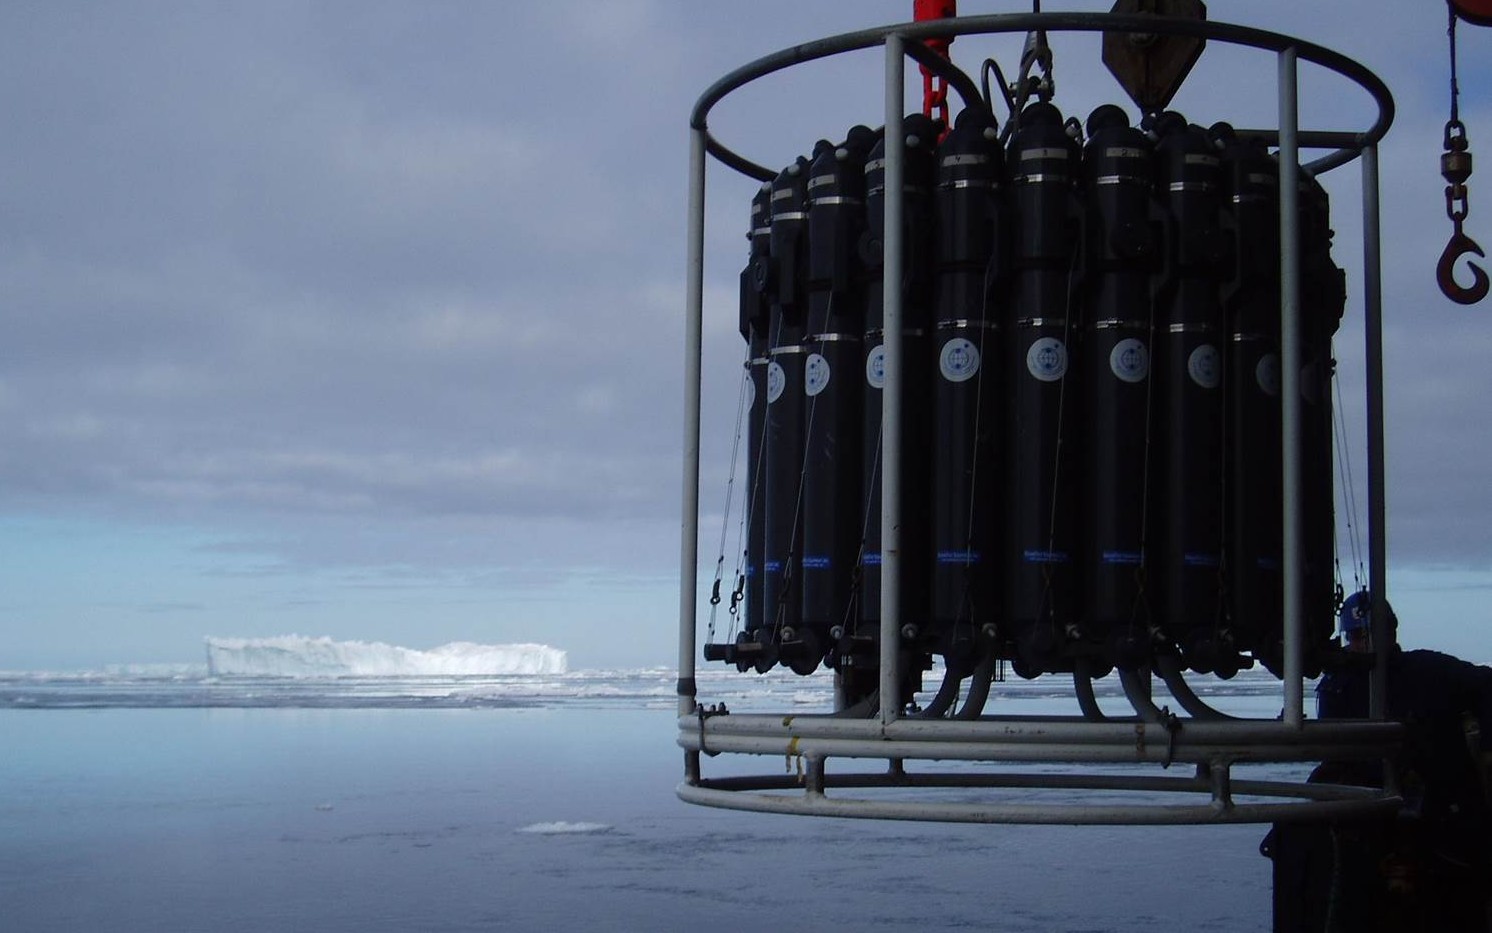
CTD – which is short for Conductivity-Temperature-Depth – is indeed a much appreciated instrument by every (sea-going) oceanographer. You send it down to the bottom of the ocean, and back comes nice profiles of temperature, conductivity (from which one can calculate salinty) – and whatever other sensor you’ve attached (oxygen, chlorophyll, and turbidity for example)
The CTD in its rosette on its way down into cold Antarctic water on a Polarstern cruise.
Most of the time the CTD is mounted on a rosette, which carries bottles so that one can also collect water samples from selected depths. But make sure to have the bottles open when you send them down – otherwise they will implode, and that is not a good thing, believe me!
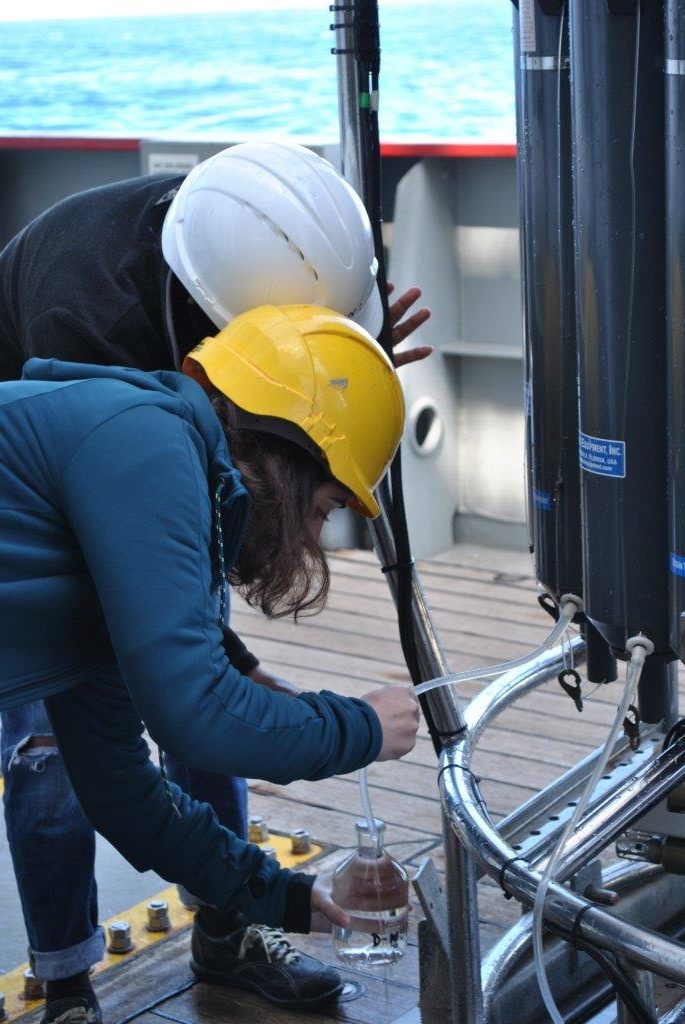
Filling bottles with water at the freezingpoint (-1.9C) is a cold job!
Kjersti, Steffi, Elin and myself (Mirjam) recently discussed ways to better integrate the GEOF105 student cruise into the course. My suggestion was to ask the students to observe things throughout the whole duration of the course, and then have them relate their time series with what they observe when “at sea”. In this mini series tagged #BergenWaveWatching, I write up a couple of suggestions I have for observations that are easy and fun to make. I am anticipating that my suggestions will be strongly biased towards #wavewatching, so if you have any other suggestions, I am all ears! 🙂
Where to go
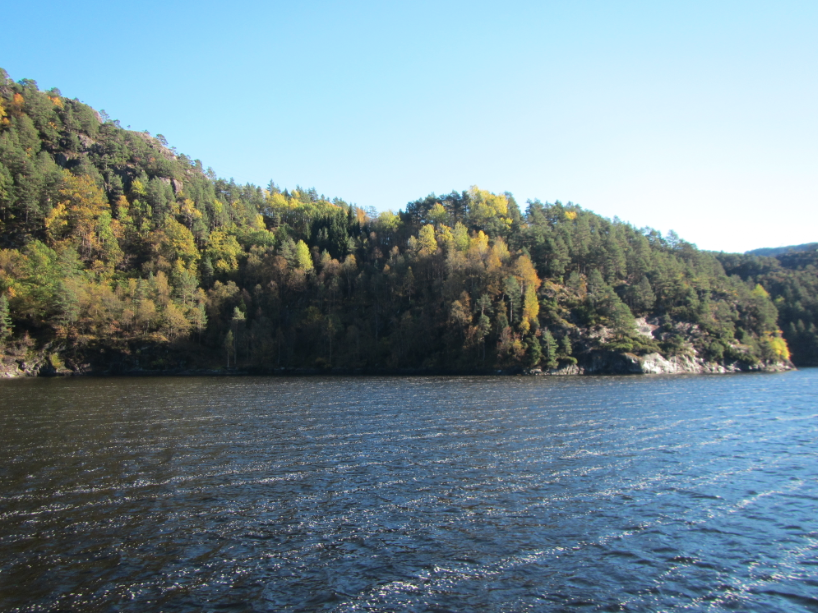
Anywhere where you can look out over water, for example Fjellveien (where the picture above was taken from) or Fløyen
When to go
Any time
What to look out for
Pattern on the water. Can you see wakes? Langmuir circulation? Gusts of wind? Areas that are sheltered from the wind?
Langmuir circulation in Østerfjorden, described here.
What to do with the data
Observe closely and try to make sense of it by relating it to, for example, ships, weather at that time, …
Do you have suggestions for us? What other spots or topics would you recommend in and around Bergen to be added to the #BergenWaveWatching list? Please leave a comment! We are always looking to expand this list!
Kjersti, Steffi, Elin and myself (Mirjam) recently discussed ways to better integrate the GEOF105 student cruise into the course. My suggestion was to ask the students to observe things throughout the whole duration of the course, and then have them relate their time series with what they observe when “at sea”. In this mini series tagged #BergenWaveWatching, I write up a couple of suggestions I have for observations that are easy and fun to make. I am anticipating that my suggestions will be strongly biased towards #wavewatching, so if you have any other suggestions, I am all ears! 🙂
Where to go
Bergen Harbour
When to go
Any time you might have to run errands around there anyway
What to look out for
So many things! Here are a couple of examples:
Waves. What direction are they coming from? What causes them?
Wakes, as a special form of waves. Which ship/animal did they originate from?
Reflections of waves on the straight walls of the harbour basin (like I did here)
Tides
Water levels in general
What to do with the data
Describe and try to make sense of it by relating it to other variables like wind speed and direction, atmospheric pressure, tides, shape of the boundaries, ships, etc, like I did for example here.
Do you have suggestions for us? What other spots or topics would you recommend in and around Bergen to be added to the #BergenWaveWatching list? Please leave a comment! We are always looking to expand this list!
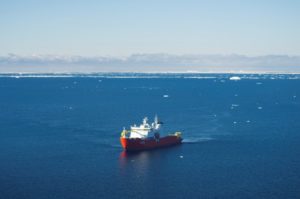
The first mooring was successfully recovered yesterday (hipp hurray!) by @cisprague & co onboard Araon – but then Araon had to steam towards the Ross Sea to help a fishing boat that sent out SOS – alarm. Finger’s crossed for a happy ending – and a quick return to science.
Araon is steaming south for a new expedition to the Amundsen Sea and it’s now out of range on marinetraffic.com (unless you pay) … but @cisprague (Christopher Iliffe Sprague – one of two Swedish students on board who will hopefully recover the moorings Karen & co deployed two years ago) is still on Twitter so internet connections onboard must have improved since I was onboard in 2016… the icebergs look the same, though!
Have a happy cruise – and good luck with recoveries & science!
Kjersti, Steffi, Elin and myself (Mirjam) recently discussed ways to better integrate the GEOF105 student cruise into the course. My suggestion was to ask the students to observe things throughout the whole duration of the course, and then have them relate their time series with what they observe when “at sea”. In this mini series tagged #BergenWaveWatching, I write up a couple of suggestions I have for observations that are easy and fun to make. I am anticipating that my suggestions will be strongly biased towards #wavewatching, so if you have any other suggestions, I am all ears! 🙂
Where to go
Bølgekraftverket in Øygården
When to go
Until recently I would have said that it doesn’t really matter when you are going, because whenever I had been there I got to see things like this:
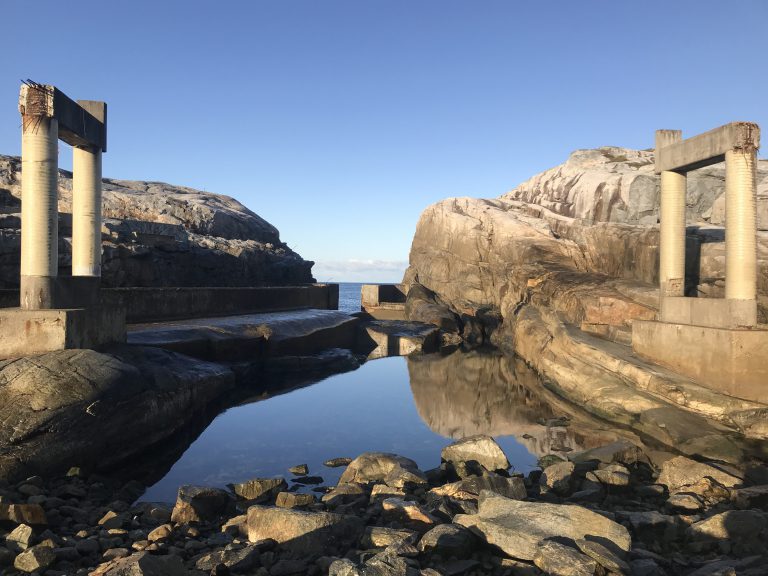
But then I went there and there were absolutely no waves to be seen, which I think was a combination of a calm day with hardly any wind, no swell coming in either, and very low water levels, possibly tides and in general. So I would recommend going there when there is wind and also the water levels aren’t super low so any potential waves actually have the chance to make it into the area of the wave power plant.
Unusually calm day at the wave power plant. See the pillars that used to carry a bridge across here?
A one-off visit on a wavy day should give you plenty of things to discover and think about, but you might get addicted and come back again 😉
What to look out for
There are at least two parts of the wave power plant where you can clearly recognize how they were supposed to work when they were still in operation. A wave power plant where waves used to drive a turbine, and another one where waves run up a funnel to fill a reservoir. But in general it’s a pretty awesome wave watching spots with some rocks that are usually just below or at water level, steep cliffs, areas that are exposed to the open ocean while others are sheltered from the waves and wind. So much to explore!
What to do with the data
“Data” here means your pics and movies of the waves.
I find it super interesting to just describe the observations of the waves around the island and wave power plant, and it might keep you busy for a while (see for example the two blog posts I linked to in the paragraph above). But you could of course also look into wave conditions in this spot. What does the wave forecast say for the day you are visiting? How do the wave conditions on that day compare to the average conditions? Or the day when the power plant got destroyed? Or the most recent extreme events? How often do extreme events occur? And what conditions actually make an event “extreme” in this place?
How this is relevant for the student cruise
Understanding waves and their enormous forces is relevant for anyone who wants to work with ocean observations or any kind of structures in the ocean. This is the ideal spot to become aware of how fragile any human structure is when confronted with the forces of nature. Also looking at wave fields more closely, both in observations and in models, is a great way to connect to what’s really going on in the ocean.
Do you have suggestions for us? What other spots or topics would you recommend in and around Bergen to be added to the #BergenWaveWatching list? Please leave a comment! We are always looking to expand this list!