A huge thanks to Jacob for his amazing work translating & prettifying & adding to & posting the calendar on GFI’s web pages & social media (Facebook, Instagram and Twitter)!
This semester, Kjersti is teaching GEOF105 under very difficult circumstances. While much of the class happens virtually, both the mandatory lab experiments and the student cruise could (luckily!) happen. So we could also do our planned Instagram-takeover of @realfaguib‘s account!
For a week, we used Instagram’s “Story” function — pictures that can be annotated and that vanish after 24 hours (not completely, you can still see a whole week’s worth of posts here if you like) — to give little glimpses of what it is like to do experiments on rotating and non-rotating tanks, and to be on a research ship for the first time.
Instagram Stories turned out a really good tool for that, for example because we could insert gifs to illustrate concepts. Above, for example, the football above the rotating tank is spinning around its own axis, while the one above the non-rotating tank is not in motion.
And of course people like seeing pictures of cruises and colorful instrumentation!
After some initial hesitation, we were lucky enough that Ide and Stephanie took over our take-over and helped make it even more authentic & fun. Thank you!
Watching their story and seeing student cruises through students’ eyes was really interesting!
With between 700 and 1000 views for each image in the story (plus some really good questions related to what we do at sea!), we feel that we had a really successful week in terms of reaching current and prospective students with interesting stories about the issues at heart of GEOF105.
That said, the only thing left to say is a huge “thank you!” to captain and crew (who, after lunch break, swapped roles) of the research ship Hans Brattstrøm, and to @realfaguib for giving us the opportunity!
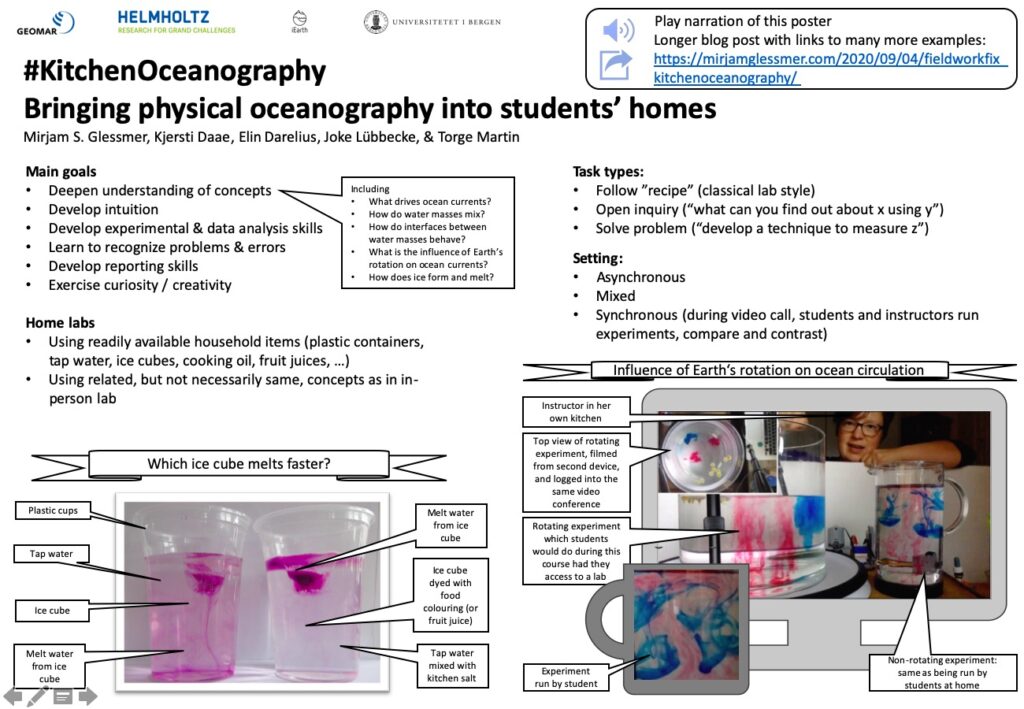
This is a (admittedly terribly crowded — but I only had 1 A4 page and there are so many interesting #BergenWaveWatching stories to tell!) poster that I am presenting on behalf of myself (Mirjam), Kjersti Daae and Elin Darelius at the #FieldWorkFix conference (September 8, 2020). If you would rather listen to my poster’s voiceover than read the transcript below, please feel free to do that here!
Welcome to our poster!
The most important learning outcomes that, in my opinion, need to be achieved with a #FieldWorkFix are to enhance motivation and interest in concepts that are being dealt with theoretically in class, and in the students’ subject in general. When students are isolated in their homes and don’t have an inspiring community of learners in their field around them, it is so important to maintain a connection to their field of study! And one way to do that is by helping them realize that what they study is relevant and meaningful in the way that it helps them explain the world they see (even if they previously neither noticed nor felt the need to explain the waves on a puddle they accidentally stepped in).
There are different types of tasks that can help students achieve that level of observation and fascination with their subject (and if you are interested in what specific tasks can look like, check out the link on our poster, that will lead you to a blog post that links to all the different examples I am giving in the following, with tons of pictures).
For example, students could be asked to find realizations of a phenomenon in the world around them. It’s good to start with an easy example that they can definitely find in many different locations. In our case, “find a hydraulic jump” works well, because those can be generated artificially by turning on the tap in your sink, or can be observed near any weir, most rain gutters, and many rivers. These examples can be shared via the classes content management system or via social media – both work well and offer the added benefit of requiring some sort of description and explanation of what was observed and where, thereby practicing both note-taking and reporting skills.
Students could also be asked to observe a specific phenomenon in a specific place and discuss how the time of observation might have influenced what they saw, and how they would set up a schedule for observations that would be best suited to document the phenomenon. An example for that is looking at a tidal current underneath a specific bridge. Depending on what time and what day it is observed during the spring and neap cycle, the flow might be observed having different strengths or even going in different directions.
I am also a big fan of the more open “find something interesting to observe that is somehow related to the concepts discussed in class”, and being open to what students come up with. If you are worried about students not finding something interesting, I would encourage you to look at my Instagram @fascinocean_kiel, where I have almost 900 pictures of mainly waves (and a few other interesting oceanic phenomena) with explanations of what I saw. Once you start looking, there is physics everywhere!
The best thing about a collection like the one on my Instagram (or the one you are building by asking students to document their observations) is that they can be used for an indoor version of this #FieldWorkFix: Assigning pictures to students with the task to annotate and explain what they see. (Which is surprisingly difficult! I get often sent #FriendlyWaves; pictures of water with the request to explain what is going on there, and while it is very entertaining and educational, it is also really difficult because many of the relevant metadata does not come with a picture).
And finally, one could give the very open task to either come up with, or answer a given, research question by doing observations in the neighbourhood.
Depending on the social distancing requirements, all these tasks could be assigned to students working either in teams or by themselves. But if one of the learning outcomes is to practice working in teams, as it often is, this can be accommodated either way:
Several students can work together on the same research question and either do this together, or – which is most likely the mode they would choose in any case – divide work and take turns taking observations. This means they are also developing observational and collaboration skills: all have to be on the same page when it comes to what properties to observe by which methods and at what place and time, how to document, how much and what kind of metadata needs to be archived, how work is split between the students, et cetera.
Students could also be given complementing tasks that they each complete individually, knowing that they will ultimately have to put their results together like a puzzle. This, again, practices a lot of observational and communication skills.
The results of these tasks can be brought together either asynchronous, i.e. students report back in writing via the content management system or social media, or synchronous in video calls where students give presentations and there is a group discussion.
Lastly, one of the big learning outcomes often associated with field work is building students’ “identity as scientists”. Students come back from the field and talk about how we, meaning we oceanographers, or more generally, we scientists, do field work. Of course, the experience of a local field trip is not the same as a multi-day research cruise. But looking for phenomena related to ones field of study has an effect on how one sees the world. Very quickly, students will look at the world with different eyes, seeing physics where other people see the sparkly ocean or a fluffy cloud. This change in perception helps students feel like a specialist on their subject, as someone who has a deeper interest and wider knowledge than most people around them, and who looks at phenomena more carefully, trying to understand them. And this is a vicious circle: once hooked, it is difficult to stop looking at the world through that lens. Which is exactly what we wanted!
Kjersti, Steffi, Elin and myself (Mirjam) recently discussed ways to better integrate the GEOF105 student cruise into the course. My suggestion was to ask the students to observe things throughout the whole duration of the course, and then have them relate their time series with what they observe when “at sea”. In this mini series tagged #BergenWaveWatching, I write up a couple of suggestions I have for observations that are easy and fun to make. I am anticipating that my suggestions will be strongly biased towards #wavewatching, so if you have any other suggestions, I am all ears! 🙂
Neither wave watching nor particularly Bergen-specific, but still super cool! And probably as close as I will ever come to suggesting any kind of meteorological observation. Clouds are pretty amazing, too, but I really don’t know enough about those…
Where to go
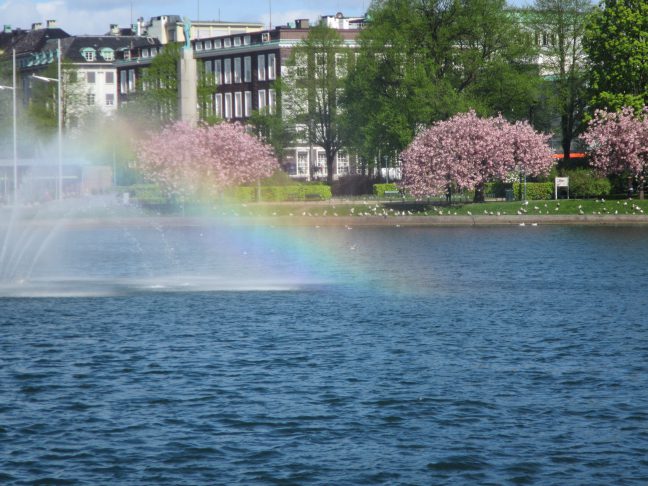
Nowhere specific, just keep an eye out for situations in which there are water droplets in the air and the sun is low enough in the sky for rainbows to appear. Be aware of where rainbows would appear if they were visible (the shadow of your head would be in the center of the rainbow) and check out if they are there.
It doesn’t actually have to rain for rainbows to appear…
When to go
Since the sun needs to be sufficiently low in the sky for rainbows to be above the ground, rainbows are more likely to appear in the morning and afternoon.
What to look out for
Duh. Rainbows?
What to do with the data
I think it could be fun to try and relate the appearance of rainbows to the kind of weather. Obviously, you need both sun and rain. But for double rainbows, you need several rain fronts behind each other. And for a secondary rainbow as in the picture on the very top (blog post on that here), you need strong sunshine.
The observations suggested here are also well suited for a description of the phenomenon and an explanation of the physics behind it.
How this is relevant for the student cruise
Not directly, but I think getting into the habit of observing something fairly specific and, over time, becoming an expert on spotting and explaining rainbows, is pretty awesome!
Do you have suggestions for us? What other spots or topics would you recommend in and around Bergen to be added to the #BergenWaveWatching list? Please leave a comment! We are always looking to expand this list!
Kjersti, Steffi, Elin and myself (Mirjam) recently discussed ways to better integrate the GEOF105 student cruise into the course. My suggestion was to ask the students to observe things throughout the whole duration of the course, and then have them relate their time series with what they observe when “at sea”. In this mini series tagged #BergenWaveWatching, I write up a couple of suggestions I have for observations that are easy and fun to make. I am anticipating that my suggestions will be strongly biased towards #wavewatching, so if you have any other suggestions, I am all ears! 🙂
Where to go
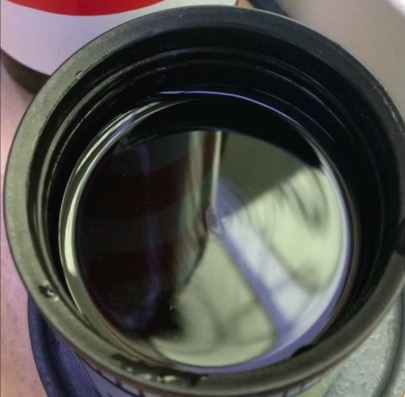
We spotted standing waves in a bucket on the latest GEOF105 student cruise, but in addition to on ships, they can also be spotted for example on trains (see pic below), in cars, or even on washing machines.
What to look out for
The pattern that form on the surface of vibrating fluids
What to do with the data
Describe the pattern and try to understand why it looks the way it does (like I did here). Is it the frequency of vibration? The shape of the vessel? The material of the vessel? The location relative to the source of vibration?
Do you have suggestions for us? What other spots or topics would you recommend in and around Bergen to be added to the #BergenWaveWatching list? Please leave a comment! We are always looking to expand this list!
Kjersti, Steffi, Elin and myself (Mirjam) recently discussed ways to better integrate the GEOF105 student cruise into the course. My suggestion was to ask the students to observe things throughout the whole duration of the course, and then have them relate their time series with what they observe when “at sea”. In this mini series tagged #BergenWaveWatching, I write up a couple of suggestions I have for observations that are easy and fun to make. I am anticipating that my suggestions will be strongly biased towards #wavewatching, so if you have any other suggestions, I am all ears! 🙂
Where to go
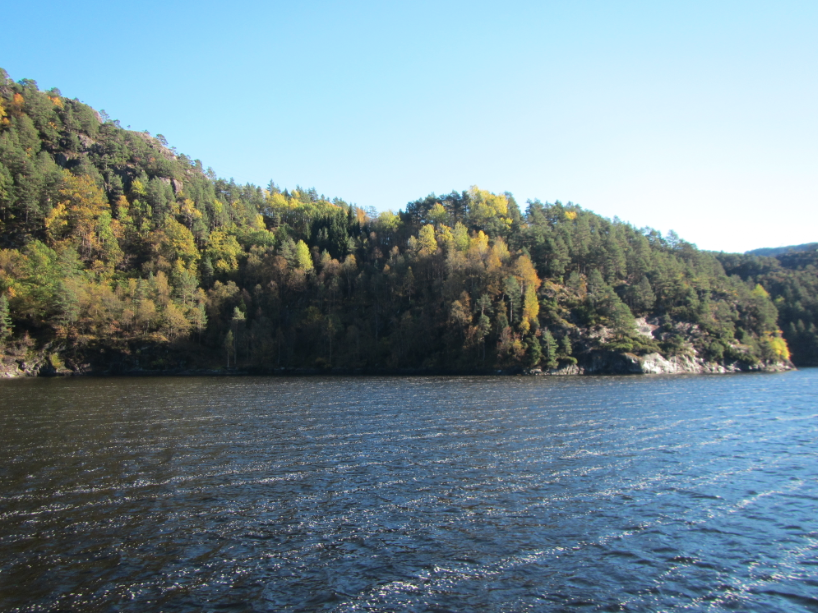
Anywhere where you can look out over water, for example Fjellveien (where the picture above was taken from) or Fløyen
When to go
Any time
What to look out for
Pattern on the water. Can you see wakes? Langmuir circulation? Gusts of wind? Areas that are sheltered from the wind?
Langmuir circulation in Østerfjorden, described here.
What to do with the data
Observe closely and try to make sense of it by relating it to, for example, ships, weather at that time, …
Do you have suggestions for us? What other spots or topics would you recommend in and around Bergen to be added to the #BergenWaveWatching list? Please leave a comment! We are always looking to expand this list!
Kjersti, Steffi, Elin and myself (Mirjam) recently discussed ways to better integrate the GEOF105 student cruise into the course. My suggestion was to ask the students to observe things throughout the whole duration of the course, and then have them relate their time series with what they observe when “at sea”. In this mini series tagged #BergenWaveWatching, I write up a couple of suggestions I have for observations that are easy and fun to make. I am anticipating that my suggestions will be strongly biased towards #wavewatching, so if you have any other suggestions, I am all ears! 🙂
Where to go
Bergen Harbour
When to go
Any time you might have to run errands around there anyway
What to look out for
So many things! Here are a couple of examples:
Waves. What direction are they coming from? What causes them?
Wakes, as a special form of waves. Which ship/animal did they originate from?
Reflections of waves on the straight walls of the harbour basin (like I did here)
Tides
Water levels in general
What to do with the data
Describe and try to make sense of it by relating it to other variables like wind speed and direction, atmospheric pressure, tides, shape of the boundaries, ships, etc, like I did for example here.
Do you have suggestions for us? What other spots or topics would you recommend in and around Bergen to be added to the #BergenWaveWatching list? Please leave a comment! We are always looking to expand this list!
Kjersti, Steffi, Elin and myself (Mirjam) recently discussed ways to better integrate the GEOF105 student cruise into the course. My suggestion was to ask the students to observe things throughout the whole duration of the course, and then have them relate their time series with what they observe when “at sea”. In this mini series tagged #BergenWaveWatching, I write up a couple of suggestions I have for observations that are easy and fun to make. I am anticipating that my suggestions will be strongly biased towards #wavewatching, so if you have any other suggestions, I am all ears! 🙂
Where to go
Bølgekraftverket in Øygården
When to go
Until recently I would have said that it doesn’t really matter when you are going, because whenever I had been there I got to see things like this:
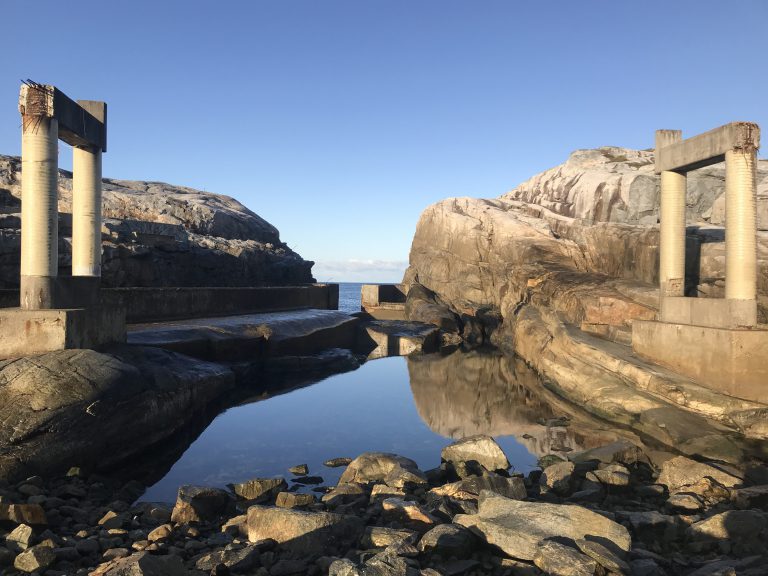
But then I went there and there were absolutely no waves to be seen, which I think was a combination of a calm day with hardly any wind, no swell coming in either, and very low water levels, possibly tides and in general. So I would recommend going there when there is wind and also the water levels aren’t super low so any potential waves actually have the chance to make it into the area of the wave power plant.
Unusually calm day at the wave power plant. See the pillars that used to carry a bridge across here?
A one-off visit on a wavy day should give you plenty of things to discover and think about, but you might get addicted and come back again 😉
What to look out for
There are at least two parts of the wave power plant where you can clearly recognize how they were supposed to work when they were still in operation. A wave power plant where waves used to drive a turbine, and another one where waves run up a funnel to fill a reservoir. But in general it’s a pretty awesome wave watching spots with some rocks that are usually just below or at water level, steep cliffs, areas that are exposed to the open ocean while others are sheltered from the waves and wind. So much to explore!
What to do with the data
“Data” here means your pics and movies of the waves.
I find it super interesting to just describe the observations of the waves around the island and wave power plant, and it might keep you busy for a while (see for example the two blog posts I linked to in the paragraph above). But you could of course also look into wave conditions in this spot. What does the wave forecast say for the day you are visiting? How do the wave conditions on that day compare to the average conditions? Or the day when the power plant got destroyed? Or the most recent extreme events? How often do extreme events occur? And what conditions actually make an event “extreme” in this place?
How this is relevant for the student cruise
Understanding waves and their enormous forces is relevant for anyone who wants to work with ocean observations or any kind of structures in the ocean. This is the ideal spot to become aware of how fragile any human structure is when confronted with the forces of nature. Also looking at wave fields more closely, both in observations and in models, is a great way to connect to what’s really going on in the ocean.
Do you have suggestions for us? What other spots or topics would you recommend in and around Bergen to be added to the #BergenWaveWatching list? Please leave a comment! We are always looking to expand this list!
Kjersti, Steffi, Elin and myself (Mirjam) recently discussed ways to better integrate the GEOF105 student cruise into the course. My suggestion was to ask the students to observe things throughout the whole duration of the course, and then have them relate their time series with what they observe when “at sea”. In this mini series tagged #BergenWaveWatching, I write up a couple of suggestions I have for observations that are easy and fun to make. I am anticipating that my suggestions will be strongly biased towards #wavewatching, so if you have any other suggestions, I am all ears! 🙂
Where to go
Pretty much anywhere you like / need to go to anyway
When to go
When it’s raining
What to look out for
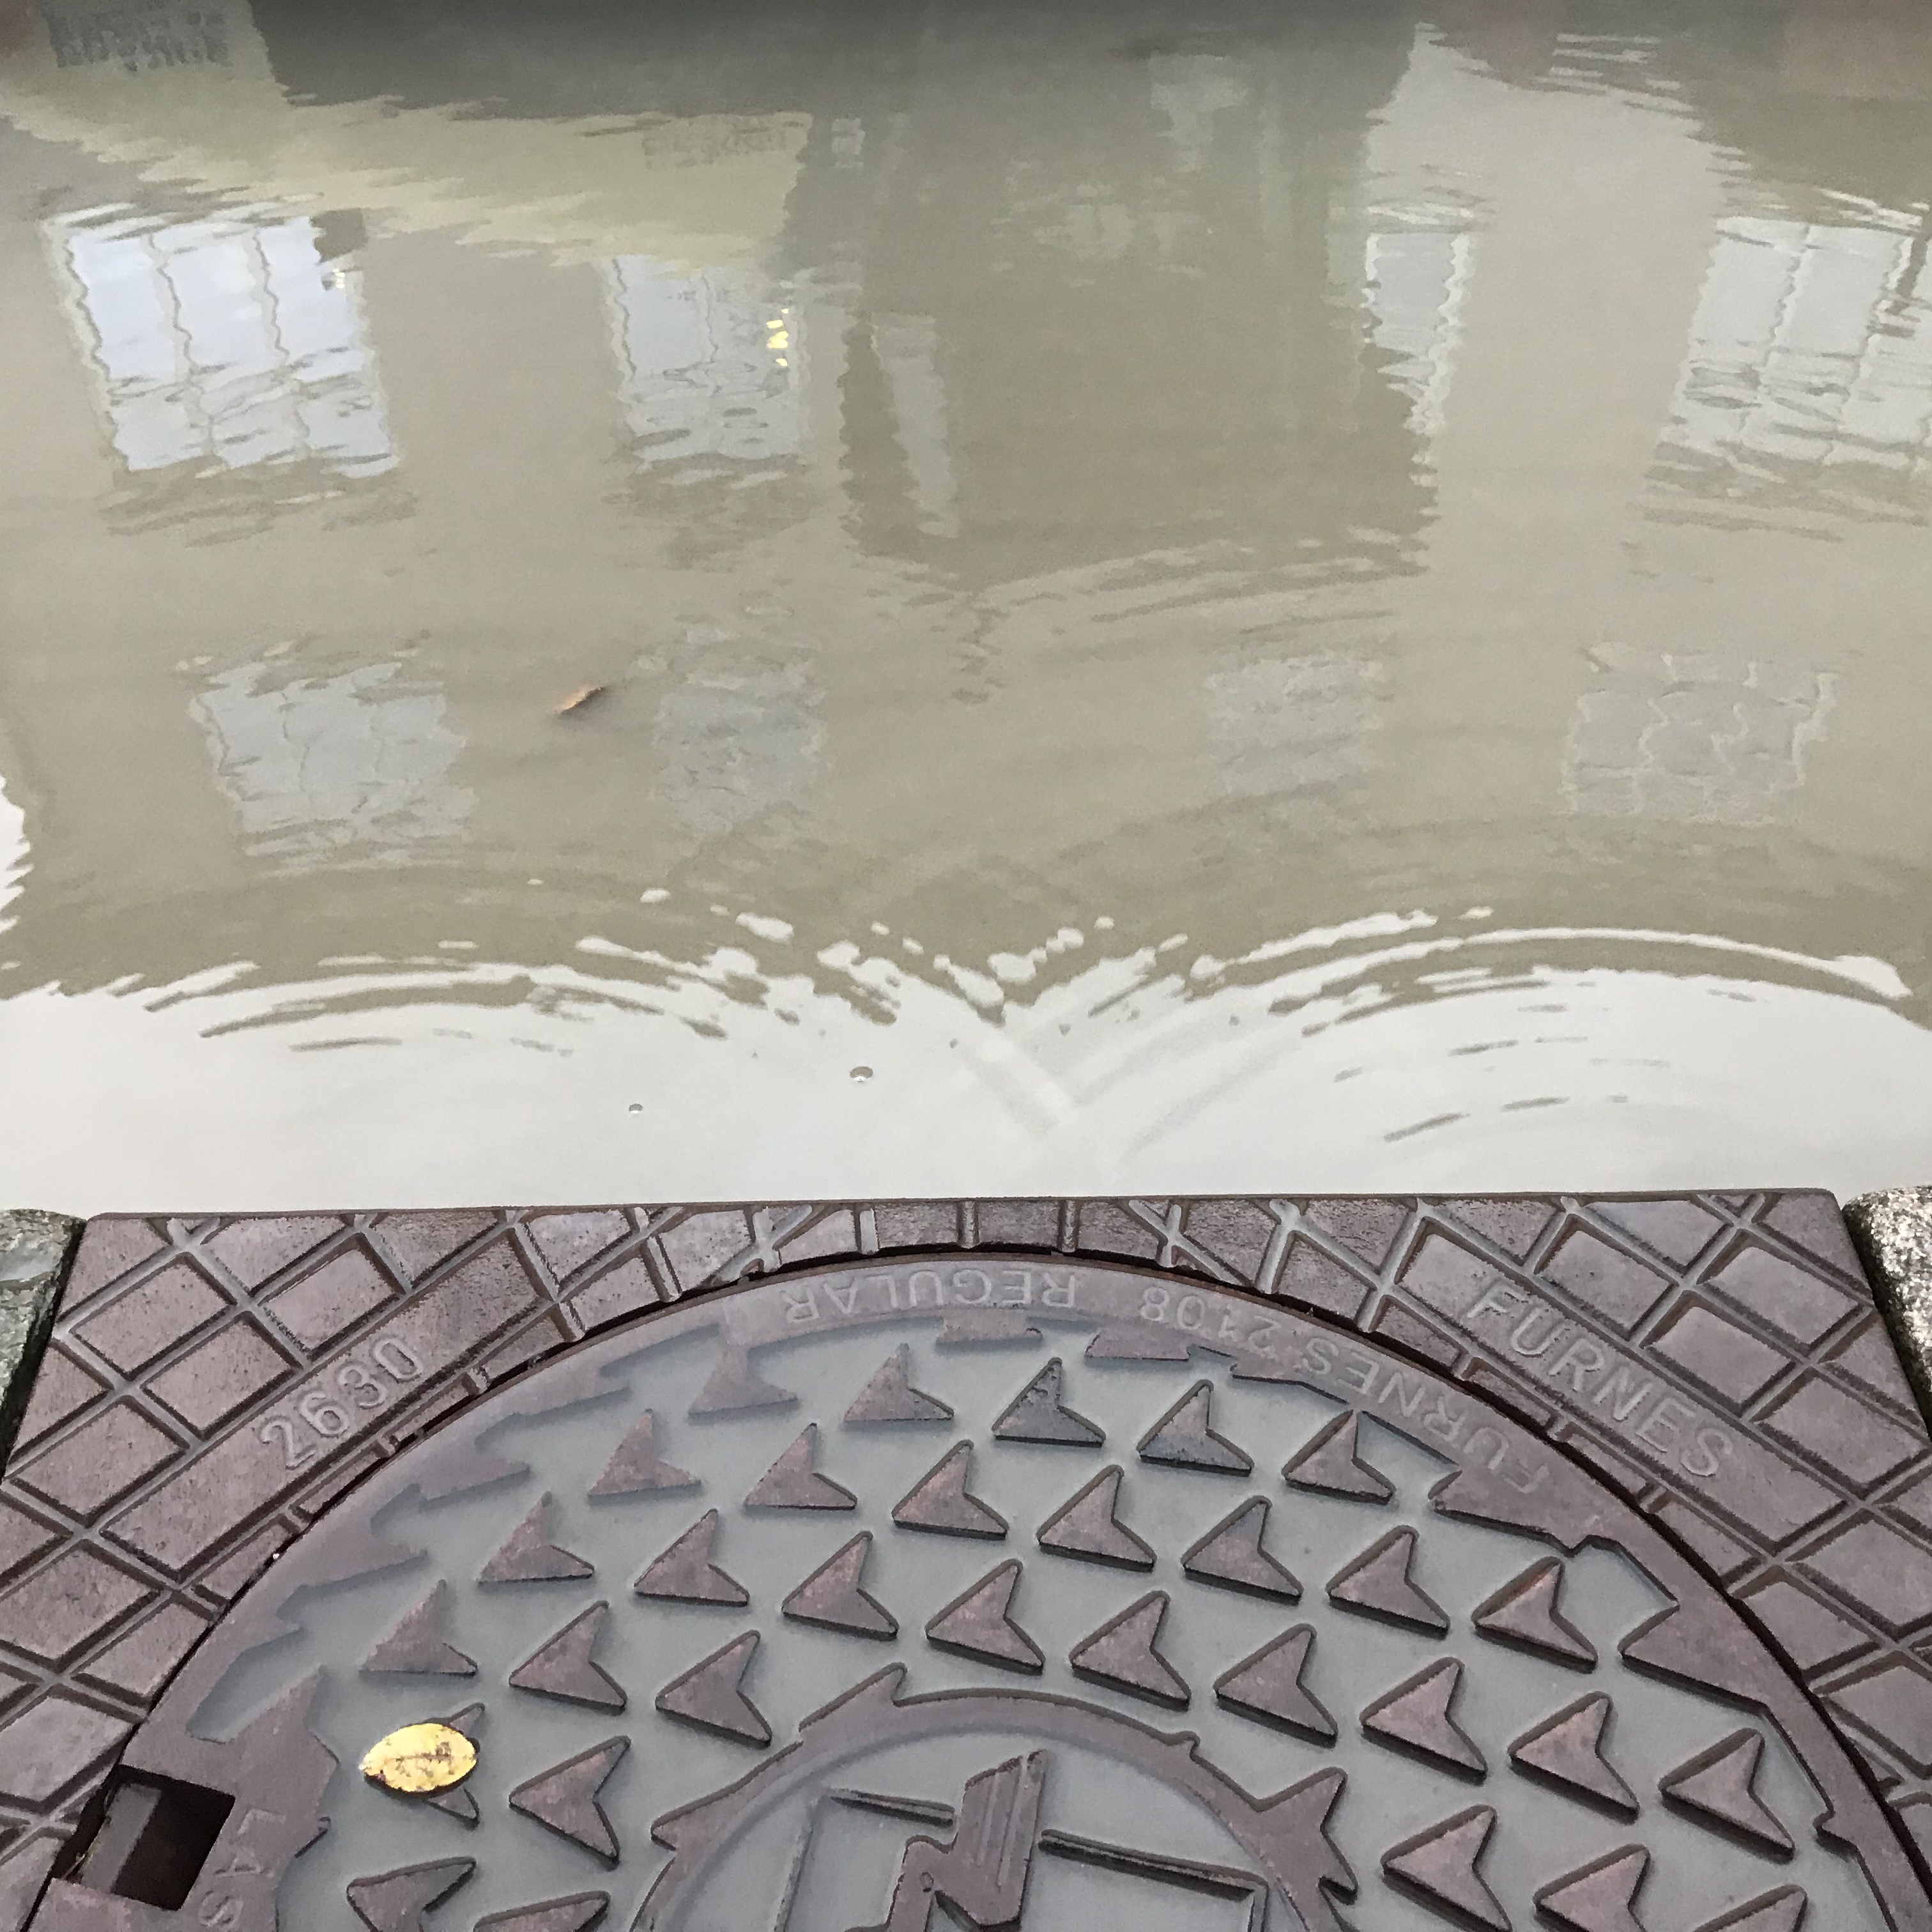
Pattern in puddles, gutters, storm drains. Because there is so much more to them than just being the means of getting rid of water or annoyances where water has accumulated! For example, check out the roll waves in the picture above and my blog post on those.
Or the picture below. What’s going on there? Solution to this wave riddle here.
Waves on a puddle on a street in Bergen. Picture from this blog post.
What to do with the data
Collect, describe, become more aware of what is happening everywhere around you.
How this is relevant for the student cruise
Not directly, it’s about forming the habit of looking at the world through the eyes of someone who’s interested in waves, which can then lead into the habit of looking at the world with a focus on anything you are specifically interested in.
Do you have suggestions for us? What other spots or topics would you recommend in and around Bergen to be added to the #BergenWaveWatching list? Please leave a comment! We are always looking to expand this list!
Kjersti, Steffi, Elin and myself (Mirjam) recently discussed ways to better integrate the GEOF105 student cruise into the course. My suggestion was to ask the students to observe things throughout the whole duration of the course, and then have them relate their time series with what they observe when “at sea”. In this mini series tagged #BergenWaveWatching, I write up a couple of suggestions I have for observations that are easy and fun to make. I am anticipating that my suggestions will be strongly biased towards #wavewatching, so if you have any other suggestions, I am all ears! 🙂
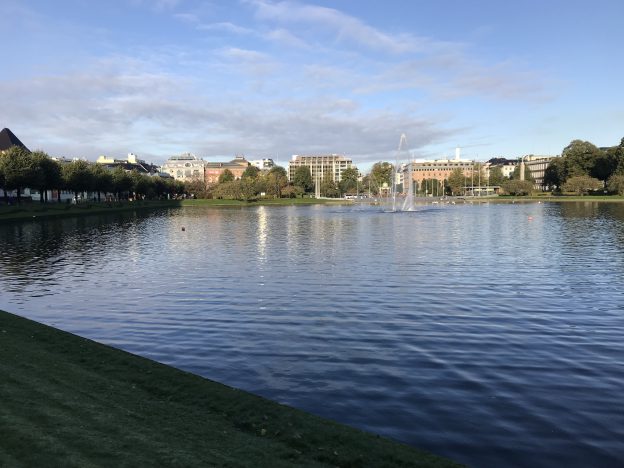
Today we have another really accessible spot in Bergen that is super well suited for wave watching!
Where to go
Lille Lungegårdsvannet in Bergen city center
When to go
Whenever you happen to walk past there anyway
What to look out for
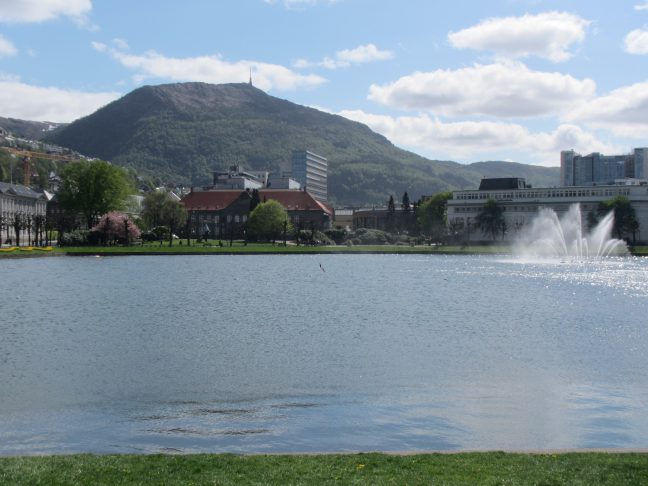
Suggestion 1: Waves and wind direction. The latter is very easy to observe from the fountain. And Lille Lungegårdsvannet is amazing for wave watching because you can walk all the way around and see waves from all sides!
Looking at Lille Lungegårdsvannet with the wind. Waves only appear at a distance from the shore in the foreground, because the water is sheltered from the wind by the shore. Blog post on this here.
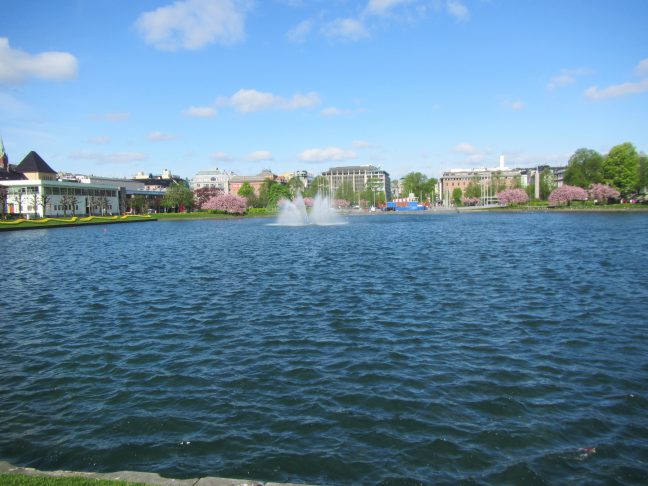
Suggestion 2: wave reflection. Due to the geometric shape of Lille Lungegårdsvannet with all the straight edges all around, wave reflection can lead to really cool pattern! Can you relate what’s going on to the wind direction?
What to do with the data
Depending on how often you go, you can either relate the wave field to the wind direction and strength (both your own estimates and what the weather forecast says about those). Or you can describe a single situation like I did for example here.
Looking across Lille Lungegårdsvannet into the wind. See how the waves are now a lot taller than in the picture above? Blog post on this here.
The geometric shape of Lille Lungegårdsvannet leads to pretty reflections! Picture from this post
How this is relevant for the student cruise
Understanding waves is very relevant for anyone being on the water. Whether you are riding off a storm, deploying instrumentation or trying to keep the boat as steady as possible for sensitive work, being able to read the waves is key.
Also, connecting observations of conditions at land and sea to wind speeds is how the Beaufort scale was originally defined. Of course, you won’t see a fully developed wave field on a body of water as small as Lille Lungegårdsvannet, but it’s a good first step to observe differences.
Do you have suggestions for us? What other spots or topics would you recommend in and around Bergen to be added to the #BergenWaveWatching list? Please leave a comment! We are always looking to expand this list!