For quite some time now, Kjersti (et al) has been working hard to set up a regional, high-resolution model of the southern Weddell Sea – and yesterday the results from all her work were finally published in GRL!
Below Kjersti summarizes her work:
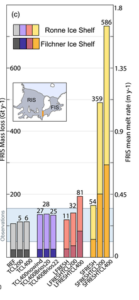
Modeled melt rates below the Filchner-Ronne Ice Shelf. Only when we applied extreme changes to the forcing did the melt rate increase. From Daae et al., (2020) available at https://agupubs.onlinelibrary.wiley.com/doi/10.1029/2020GL089237
The Filchner-Ronne Ice shelf comprises 450 000 km2 and is the world’s largest ice shelf by volume. In contrast to the rapidly increasing melt rates in the Amundsen Sea, the Filchner Ronne melt rates are low, and a cold-shelf-regime dominates in the Weddell Sea. Warm water of open-ocean origin has limited access to the shelf and the cavity beneath the Filchner-Ronne Ice Shelf. But how could this system change in the future? Could global warming lead to a regime shift from cold-to-warm in the Weddell Sea?
We have studied the Weddell Sea system using a regional ocean model with idealized forcing to learn more about the processes that control warm water flow onto the continental shelf and further into the Filchner-Ronne Ice Shelf cavity. Two main factors currently prevent warm water from accessing the Weddell Sea continental shelf. Firstly, the warm water is located deeper than the continental shelf and does not have direct access. Secondly, the Weddell Sea continental shelf is filled with dense water masses that block an inflow of warmer and lighter water. We find that the Weddell Sea system is robust, and we need to make extreme changes to both factors to allow warm water access to the continental shelf.
Today we are doing the melting ice cubes experiment in fancy glasses, because Elin is giving a fancy lecture tonight: The Nansen Memorial Lecture of the Norwegian Science Academy in Oslo! Cheers!
We each had green ice cubes in our glasses, but one of our glasses contained fresh water and the other one salt water, both at room temperature. Can you figure out who got which glass?
This time lapse might give you a clue…
To read more about this experiment, check out this blog post!
Oj, oj, oj – I just received the official invitation to give the Nansen memorial lecture at the Norwegian Science Academy in Oslo – and to have dinner afterwards in this beautiful room! Very fancy!!! It will all take Place on 10th of October – Fritjof Nansen’s birthday. I wonder if there will be cake?!
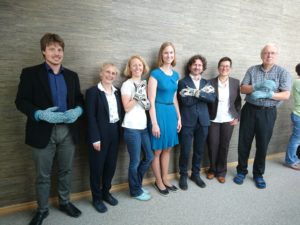
Yesterday Kjersti successfully defended her thesis “Exchange of water masses between the Southern Weddell Sea continental shelf and the deep ocean”!! Hipp hurray for Kjersti! Kjersti is my first PhD-student who finishes – so I admittedly was a bit nervous… but not as nervous as Kjersti… But she did (as usual!) an excellent job presenting her work to relatives and colleagues her at GFI – and she responded nicely to all the questions from the opponents: Karen Hayewood and Angelica Renner. We had the chance to have three excellent female oceanographers at the stage at GFI – that’s does not happen that often!
Supervisors, opponents and PhD. Kjersti Daae! Photo: Ellen Grong
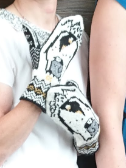
While finishing off her thesis Kjersti had found the time to knit mittens to us all (see photo and note the Penguins!) – thank you Kjersti!
Kjersti’s Penguin mittens – will definitely join me on my NeXT trip Down south!
…Hurray! We got money from the university to send Nadine (and some instrumentation) onboard “Kronprins Håkon” (KPH amongst friends) to Antarctica next season! KPH is the brand new Norwegian icebreaker and she will sail down to Dronning Maud Land and Fimbullisen in February, 2019.
Fimbullisen is a relatively small ice shelf that overhangs the continental slope in the eastern Weddell Sea. The Norwegian Polar Institute (NPI) has three sub-ice shelf moorings installed there, and two years ago we added an APRES (a handy little thing that you place on top of the ice to measure time series of ice shelf thickness from which one can infer the basal melt rate) to one of their sites. The plan is now to – in collaboration with NPI – also measure what happens outside of the ice shelf cavity.
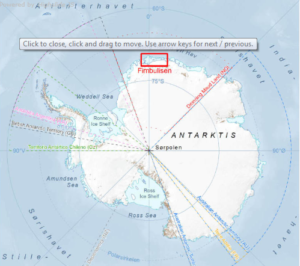
Map over Antarctica with the Fimbull ice shelf marked in red. From npolar.no.
In February last year we recovered a mooring at the Filchner Ice Shelf front (See map below) that we since long had consider lost. The large German ice-breaker Polarstern had failed to reach it twice due to sea ice, and it had now been in the water for more than four years. When we reached the location with (the much smaller) JCR last year, the mooring was only a few hundred meters from the advancing ice shelf front, and the captain was somewhat hesitant to go there – but he did, and the acoustic release on the mooring SA responded and released as promptly as if it had been deployed the day before! Most of the instruments had run out of battery and thus stopped recording – but one of them were still running, providing a four year long data record!
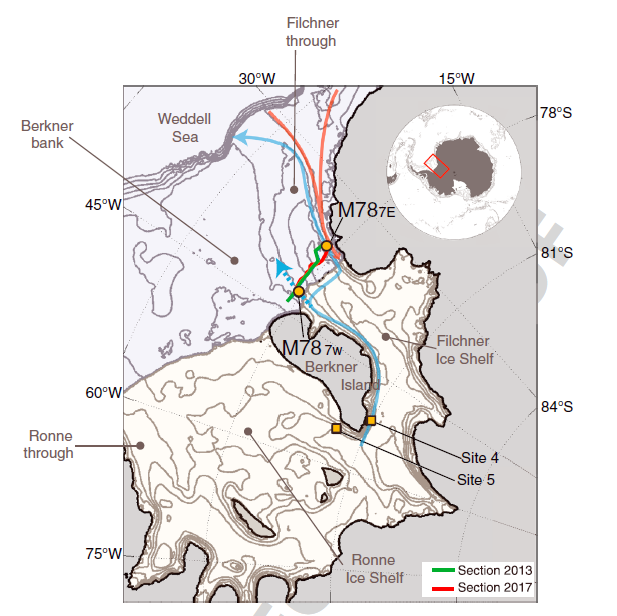
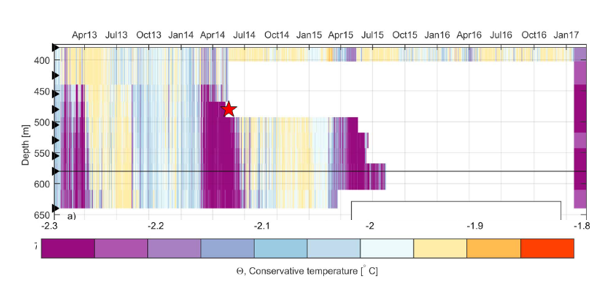
The mooring had several temperature and salinity sensors, and the records from them showed that there is a pulse of very cold (-2.3C!) ice shelf water (see explanation below) leaving the cavity during late summer and autumn each year. The water has been cooled down so much through interaction with the ice shelf base at depth, that there are ice crystals forming within it as it rises and leaves the cavity (I’ll write about what the ice crystals did to our instruments in a later post). The salinity of the cold water was relatively high – telling us that the water most likely entered the ice shelf cavity in the Ronne Depression, west of Berkner Island (see map).
In an earlier paper**, we had shown (using a numerical model) that ice shelf water flowing northward along the Berkner island would turn east when it reaches the ice shelf front (because conservation of potential vorticity hinders water to flow across the ice shelf front where the water depth suddenly changes by hundreds of meters) and exit the cavity in the east. But now the data showed that water was exiting the cavity in the west anyway?! What about the potential vorticity?? Our data also show that when cold water is flowing out of the cavity in the west during late summer, there is layer of less dense (and warmer) water present above it. In the paper we suggest that the presence of the upper, lighter layer breaks the potential vorticity constraint. The layer of less dense water reaches down roughly as deep as the ice shelf itself – and you can imagine that to the outflow it acts as a continuation of the ice shelf.
We now know that water leaves the ice shelf cavity also in the west – but where does it go then? Is there a flow of dense ice shelf water also along the western part of the Filchner trough?
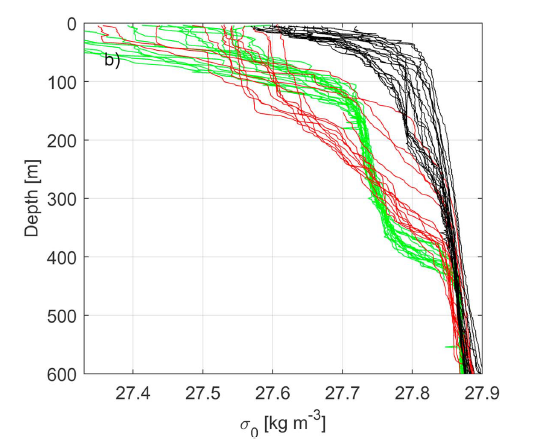
Map over the southern Weddell Sea. The yellow dots show where our moorings were deployed, and the blue arrow show the path of the ice shelf water. From Darelius & Sallée, 2018.Temperatures at the front of the Filchner ice shelf. Note that the temperature scale goes down to -2.3C! At the surface seawater can not be colder than -1.9C, then it freezes. Modified from Darelius & Sallée, 2018.Density profiles at the ice shelf front. Red and green profiles are from periods with outflow – you see that the density decreases around 400 meters, roughly at the level of the ice shelf base. The black profiles are from a period without outflow – the density does not change at the depth of the ice shelf base. From Darelius & Sallée, 2018.
Ice shelf water: We define water that has a temperature below the surface freezing point (which is about -1,9C for sea water) as “ice shelf water”. The water leaving the cavity was as cold as -2.3C (See figure 2 above)! How can it be so cold? It is a combination of two physical facts: 1) The freezing point decreases as pressure increases and 2) water in contact with ice will have a temperature equal to the freezing point. In an ice shelf cavity we have ice in contact with water at large depth ( i.e. at large pressure) and the water will then be cooled down (the heat given off by the water is used to melt ice) to the local freezing point – and voila, you’ve got ice shelf water!
* I say my, but it’s a team effort: many thanks to J.B. Sallée who co-authored the paper and to all the people involved in deploying and recovering the moorings!
**Darelius, E., Makinson, K., Daae, K., Fer, I., Holland, P. R., & Nicholls, K. W. (2014). Circulation and hydrography in the Filchner Depression. Journal of Geophyscial Research, 119, 1–18. http://doi.org/10.1002/2014JC010225
As scientists it’s not enough to only do research alone in our little office, but we also need to get among other scientists to find out what new research is being done, to network and to make other’s aware of our important piece of work. Each year, there is a big European geoscience conference (EGU) in Vienna which again took place last week. 15000 scientists attended from more than 100 different countries and I (Nadine) was among them! In my luggage: A poster presenting our experiments at the Coriolis platform and some first results. This was very exciting, because it is a unique opportunity to talk to other scientists doing similar research. I was even co-convener in a session about the Southern Ocean which means I got to pick the talks and helped preparing everything in advance! After that week I was very exhausted, but happy! The program was stuffed with interesting talks and posters about Antarctica, oceanography, ice shelves, ice shelf—ocean interaction and glaciers and I got to talk to many skilled, interested and motivated scientists. All of them loved our experiments on the water-filled mary-go-round!
Happily presenting our poster at this year’s European geoscience conference (EGU) in Vienna!
Writing a scientific article is a long process – you collect the data, you calibrate them, process them and you analyze them. You plot them, think about them, discuss them, think about them again until hopefully, at some point, the data give you results that you can understand and – publish. So you write the paper – in between meetings and teaching you somehow manage to squeeze your outstanding results and neatly prepared figures into the template provided by the journal. Then you submit – and forget about it all until you hear back from the editor three months later: the REVIEWS are back… sometimes it’s like this:
i.e. you quickly find out that your results were not that outstanding and your figures not that neat… the reviewers have filled page after page with “Did you consider…”, “why didn’t you calculate…” how does this compare to..”, “can you really ignore the effect of….” and “you ought to refer to the paper by mr so and so”…so you start over, you do all the extra analyses that reviewer three asked for, you make new figures, you clarify and expand and include a citation of mr so and so (the reviewer?). You read and write the text over and over and at some point you realize that you’ve done all that they ask for… and that version 6.2 of the paper is indeed much better than version 1.0. So you write a very polite letter to the editor, where you respond to each and every comment from the reviewers and explain what you’ve changed – and then you resubmit. And you wait. Again. For three months.
… but then sometimes, you get three short lines from the editor stating that you paper is accepted! It will be published!!! YES!!!
I received one of these e-mails the other day – and once the paper get online in a couple of days I’ll let you know what it is all about!
We are excited and grateful for a great opportunity for continued collaboration that has recently presented itself: Elin won a Bjerknes Visiting Fellowship 2018 for me (Mirjam) to visit Elin and the rest of her team in Bergen for a month in 2018!
We have several goals for that visit, but the main one is to develop more hands-on experiments (which we lovingly call “kitchen oceanography”), which parents, teachers, and other educators can use to get children excited about oceanography (and obviously for the grown-ups to play with, too :-)). Between Elin and me, we do already have a lot of experiments which we use regularly and recommend (for Elin’s, check out this site, and mine are here). But we would love to bring them in a different format so that they are easy to find and use, and are well integrated with the ekte data project. And then, obviously, we want to let everybody in Bergen (and all of our faithful readers) know where to find the experiments, and how to use them in science communication.
So plenty of stuff to stay tuned for! We’ll absolutely keep you posted on our progress on here!