Is there plastic litter in the Southern Ocean? – A response to AMA

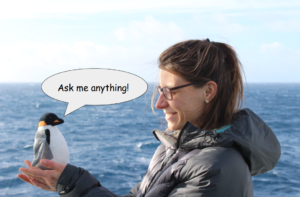
After I got used to solid ground again, I would like to come back to the questions that I got from the Ask Me Anything event. Those questions posed on Reddit are answered directly there and I replied to some questions directly in an email. There was one specific question left that I want to write more about:

Is there plastic litter in the Southern Ocean?

Global plastic production has increased by >500 times over the last 60 years (Thompson et al., 2009). People all around the world are becoming increasingly aware of the big problems that our plastic polution causes to the oceans and to the marine wildlife. Microplastic (plastics smaller than 6mm) comes either as a secondary source from breakdown of marcoplastic, or directly from personal care products like shampoo, soap or synthetic fibres from the laundry. Microplastics are found in their highest concentrations along coastlines and within mid-ocean gyres. The World’s Ocean contain 63 320 pieces per km² and the East Asian seas 1 720 000 pieces per km² (Isobe et al., 2015; Eriksen et al., 2014).

The Southern Ocean is so remote from the sources that it was thought to be mainly free of plastic pollution. However, there are studies that show that microplastic is also found in the Southern Ocean, mainly  in deep-sea sediments and the surface. It is partly transported across the ACC from other oceans and partly caused by ships and research stations in Antarctica (Waller et al., 2017). Especially microplastic can be transported far through the ocean currents as all world oceans are connected to each other.

In total, nobody knows how much plastic there is in the Southern Ocean, as it has only been measured at a few locations. But we know that there is no piece of ocean that can be completely save from plastic pollution. Also, it has not been measured yet how big the impact of microplastic is on Antarctic species; but in other oceans it causes reduction in energy reserves, ability of feeding and reproduction in marine biota (Cole et al., 2011).

Thanks and goodbye!

We had an amazing and unforgettable cruise to the Southern Ocean, but it is time now to leave RV Kronprins Haakon and say goodbye to everyone. Despite the fact that the heavy sea ice prohibited the science close to the ice shelf, we managed to find alternative plans and we got some interesting findings. I am very excited about the scientific papers that will come out of it and new projects. Personally, I learned a lot both about marine science but also about managing and planning a cruise.

I want to thank the crew and the other scientists for great work, collaboration and also an amazing time! During those 7 weeks I found a lot of new friends with whom I am enjoying the last days together in Cape Town now. In the end, I also want to thank my supervisor Elin to make this cruise possible for me, to find the funding and arrange everything!

With that I send you the last pictures of some penguins, whales, seals and ice bergs! GOODBYE 🙂


Photos: Rudi Caeyers, NPI


About RV Kronprins Haakon

Now, our expedition is over and we are docked onto the pier in Cape Town, where we will finally step onto solid ground again. Before saying goodbye here on the blog, I would like to tell you a bit about the ship that we have been working and living on for the last 7 weeks during our Antarctic adventure:
the brand new Norwegian ice breaker RV Kronprins Haakon.

Norway has a long history in polar research. The research institutes always make sure that they have the infrastructure to conduct fieldwork in rough conditions and heavy sea ice. Following the examples of “Fram” and “Maud” on which Fridtjof Nansen and Roald Amundsen wrote history, “Kronprins Haakon” has now started to cut through the ice for the new generation of polar explorers. During the last decades, “Lance” was used for polar research although she was originally built for fishing and sealing. However, now she is an old lady from 1978, who has already sailed to the moon and back in distance (860 000km) and has finally retired in 2017 from the duty for the Norwegian Polar Institute. “Kronprins Haakon” was built in Genova, Italy, and is now jointly owned by the University of Tromsø (50 %), Norwegian Polar Institute (30 %) and Norwegian Institute of Marine Research (20 %). On November 17, 2018, the ice breaker was baptized by the Princess Ingrid Aleksandra in a very symbolic way: with a sea ice core to symbolize the use of the ship in polar regions.

The 100 m long ship has room for 55 people including the crew, but most of the space is used for the 14 laboratories, a helipad, hangars for two helicopters and a moonpool to lower instruments into the ocean even with thick sea ice cover. In addition, it has a remotely controlled submarine that goes down to 6000 m depth, an eccosounder to measure the ocean floor and organisms in detail, and many other instruments. Here you can see a youtube video about the ship: https://www.youtube.com/watch?v=ok6KWKznzXo&feature=youtu.be

Our team in front of the beautiful ice breaker before going on board in Punta Arenas. Photo: Rudi Caeyers

My work on board: CTD measurements

There were so many exciting things happening on the ship that I almost forgot to write about the main work that I have been doing during this cruise: CTDs! The fact that the sea ice conditions didn’t allow us to deploy the mooring that I brought, doesn’t mean I could lean back and have holidays. CTDs are almost taken all of the time and our team was split up in 2 shifts. I always worked from 12:00 – 16:00h and from 20:00 – 04:00h, which means that we basically only got a few hours of daylight (it was dark from about 18:00 – 04:00 UTC). This can be tiring, but from the CTDs we can learn a lot about the physics, chemistry and biogeochemistry in the ocean, which again is important when studying oceanography and the ecosystem in the ocean.

The CTD team gathered around the CTD frame. Left side up to down: Sebastien M., Thomas R.-K., Asmita S., Agneta F., Kristen F., me, Tore H. Right side up to down: Hanna K.. John Olav V., Melissa Ch. and Laura d.S. Photo: Rudi Caeyers, NPI.

But now a deeper explanation of the work:

CTD means Conductivity (Salinity) -Temperature-Depth. You can imagine a big yo-yo that goes all the way to the ocean floor and up again, measuring those three values throughout the whole water column. Since we already send down those sensors (which can takes about 100 min for 3000 m water depth), we can equally do more measurements on the way down. We had also an LADCP (Lowered Acoustic Doppler Current Profiler to measure velocity), a flourometer, transmissometer, Biospherical/Licor and an oxigen sensor. In addition, there are Niskin bottles attached to the CTD frame (the grey bottles on the picture), which take water samples at different depths. The water samples are used for calibration of the sensors, but also to measure biogeochemistry and chemistry in the water.

In total, we did 65 CTDs and took about 3800 water samples from the Niskin bottles to analyse them afterwards in the lab. Whenever the CTD came up from it’s yo-yo dive, we had to take the water samples, filter them and analyse. It was my task to analyse the concentration of dissolved oxygen in the water samples, which tells about the age of the water and the biological activity. Super exciting! Sometimes we were just done with the tasks, when the CTD came on deck again to do it all over again at the next location.

I am sure, we will have interesting results, once we have looked at the data more closely!

Hanna and John Olav practicing how to take water samples from the CTD.
Winkler titration system “Relou” Metrohm Ti-Touch 916 that I used to analyse dissolved oxygen.

Ægir – observing life at the ocean floor

While most Norwegians associate Ægir with something else, did you know that Ægir is the jötunn (some kind of god) of the oceans? Here on board of RV Kronprins Haakon, we have an ROV (remotely operated vehicle) called Ægir  https://oceanlab-no.weebly.com/rov.html which is some kind of robot that dives along the ocean floor filming and picking up whatever could be interesting to study. It is attached to a winch on the ship and can go down to 6000 m depth! While it films the ocean floor, we can watch the movies live from the ship. Like that, the biologists on board can tell the ROV-pilots which animals, corals, sponges or other plants should be picked up or sucked up with the ROV and brought on board for later studies.

The ROV Ægir6000 with the UiB-crew on board. In the back (left – right): Stig, Patrik; in the front (left – right): Nadine, Karoline, Tone, Anne Helene, Eyvind. Photo: Stefano Ambroso

It was very unclear to us, how the ocean floor would look like in Dronning Maud Land and what to expect, so it was very exciting to watch! Here is a collection of pictures that the ROV took of corals, fish, anemones, sponges, squid, sea stars and jellyfish.

Pictures taken at the ocean floor with the ROV Ægir6000 from the University of Bergen.

Ask me anything!

So far, I have been blogging about whatever I find interesting on our cruise to Dronning Maud Land.
Now it’s your turn to tell me what you would like to know!

There are two possibilities for you to send in questions:

  • I created an Ask Me Anything (AMA) – event on reddit, where you can drop questions
  • There is a google doc (link: AMA google doc)  to ask questions in case you don’t want to sign up for reddit.

    Your questions will be collected until the 12th April after which I will make a blog post with my answers!

The influence of the ocean on Fimbulisen

In the last blog post, Elin wrote that I called her with bad news from Dronning Maud Land, because the ice didn’t allow us to deploy the mooring. But what was actually our aim with that mooring? What did we want to learn? For that I need to tell you about the Southern Ocean and ice shelf ocean interaction…

The Southern Ocean is very important for the global system for different reasons:

  • Cold temperatures and high salinities close to the Antarctic coast form very dense water masses. They sink down to the bottom of the ocean and drive the whole global ocean circulation.
  • The ocean can melt ice shelves – the floating extensions of the ice sheet. Consequently, more of the Antarctic Ice Sheet flows into the ocean and causes sea level rise.

Regarding the ice shelves, they are mainly melting because “warm” water reaches the ice. “Warm” in this sense is not really warm… It only means warmer than the freezing point, which can go Down below -1.9oC in salt water and under higher pressure at depth. It is very difficult to measure temperatures and currents under an ice shelf. But 10 years ago, one of our oceanographers on board, Tore Hattermann from NPI, went to the ice shelf Fimbulisen here in Dronning Maud Land to drill holes in the ice shelf and install moorings underneath. Since then, those mooring have been measuring temperature, salinity, oxygen and the current speed underneath the ice, where we otherwise can’t measure anything Those are really impressive data!

Sketch of Fimbulisen with the moorings installed under the ice shelf (M1 & M2) and the moorings we wanted to install in front if the ice shelf during this cruise (DML1 & DML2; Hattermann et al., 2012).

So what did Tore find out?
There are three different ways how warm water can reach an ice shelf (Hattermann et al., 2012):

  • Water that is a the freezing point at the surface cannot melt ice at the surface. But ones it sinks further down, the freezing point decreases because of the higher pressure, so the water is warmer than the local freezing point and can actually melt the ice.
  • Warm Deep Water (T < 0.6oC), which is off the continental shelf break and in greater depths can spill over the continental shelf break in short pulses. It flows then into the ice shelf cavity on the bottom as Modified Warm Deep Water.
  • In summer, the surface heats up by the sun. The Winds can then press the surface heated water Down to Depths where it can enter the ice shelf cavity.

However, the heat entering the cavity through those processes is relatively small in the case of Fimbulisen and the melt rate beneath  the ice shelf is low. But what does it have to do with our cruise?
We want to know, how the water masses in front of the ice shelf, at the continental shelf break change with time. Therefore we wanted to install more moorings that could measure the depth of the Warm Deep Water etc. Maybe the winds change with time and consequently also the currents? Also changes in the sea ice can change the density of the water and cause a change in water masses.

It would have been very interesting to study those processes in an area, where so good data from the ice shelf cavity and ice shelf melt exist. We were therefore quite sad, that we couldn’t reach far enough south due to the sea ice restrictions. Luckily, we managed to install two other mooring that the oceanographers from NPI brought, although we had to place them further north than intended. We’ll find out in two years if the data are interesting! And keep the fingers crossed that the instruments won’t get overrun by icebergs or break for other reasons!

First mooring from NPI that we installed during night west of Astrid Ridge. Here, the sediment trap as part of the mooring is being lowered into the water.
The last instruments of mooring 1 are lowered over board with a big crane.
Lowering a flotation element of mooring 2 into the water. In the background sea ice and icebergs.
Together with Kristen, I am attaching one of the temperature sensors on the mooring that will go in the water.


Changing plans…

Sea ice – beatuful to look at, but difficult to make plans With…

My phone rang twice yesterday – the first time it was Anna Wåhlin, who had just sat her feet on land again in Punta Arenas, Chile after two months in the Amundsen Sea With Ran.
The second time it was a local, Bergen number and I was very surprised to hear Nadine’s voice on the line! It still amazes me, that (when things work) you can talk to someone on a ship in Antarctica and it sounds as if they are in the room next door…
She had bad news, there were too much ice, the captain couldn’t go nearly as far south as we had hoped for to deploy Our moorings and we have to move them further north to deeper water. 1500m instead of 800m. Where should we add the extra line? Should we rearrange the instruments? We discussed a bit and agreed on a solution.

When I woke up this morning there were five missed calls from the same Bergen number – and there was soon a new call from Nadine.
– More bad news. The captain couldn’t make it even to 1500m, they were now about to deploy the NPI mooring at 2000 m. What should we do with ours? No point in going deeper, we don’t have more lines to add and many of the instruments can’t be deployed that deep. Deploy it on Maud Rise? Move instruments over to the NPI mooring and bring the rest home? Bring them all home? Not an easy decision!

A history lesson on Dronning Maud Land

The first person who set his foot on Dronning Maud Land was a Scottsman William Bruce. After that, the Norwegian ship owner Lars Christensen financed 9 expeditions for whaling and sealing with the ships “Odd”, “Norvegia” and “Troshavn”, as well as aircrafts to map the area. The first expedition was under Hjalmar Riiser-Larsen in 1929-30 when the name Dronning Maud Land was first applied. To claim the area as norwegian territory, a norwegian flag was thrown out of an airplane at the western boundary. In 1938-39, the Germans started an expedition led by Alfred Ritscher with the ship “Schwabenland” and two aircrafts that they used to fly over the territory seven times within 17 days, They photographed an area of 350 000 km² and dropped down several Nazi-flags. They wanted to claim the area as theirs.
Luckily, the norwegian Adolf Hoel came for a visit to Berlin, where he found out that his friend had left to an Antarctic expedition. Adding two and two together, he guessed what the Germans planned and notified the Norwegian government. On 14 January 1939 – five days prior German arrival–, king Håkon VII officially annexed Dronning Maud Land as Norwegian territory.

Beautiful phytoplankton – the basis of the marine food web

On the way to our intensive study area in Dronning Maud Land, the work package leaders on RV Kronprins Haakon constantly have to keep the cruise plan updated with the time schedule and with sea ice conditions, weather and whatever interesting is coming up on the way.

In one location, the observers on board spotted more than 100 whales, compared to about 5 on other days. The whales are there for one reason: food! And the food chain starts all the way down with primary producers that are the food for krill. The Antarctic krill has an estimated biomass of around 389 000 000 tonnes, which is more than the global population of humans! More than 50% of this mass fuels the ecosystem: the whales, seals, penguins, squid and fish.

Primary production in the Southern Ocean is generally low despite high nutrient concentrations. This is due to low iron concentrations. It increases close to islands, coasts, sea ice edge and icebergs. In Dronning Maud Land, many processes that increase primary production come together and green sea ice filaments can even be seen on satellite images.