On our way home

The wind is strong and the waves are high. The ship is rolling, up and down, up and down… It is difficult to walk straight down the hall way and we hold tight to the hand rails when walking down the stairs for dinner. I do hope they are not serving soup…
Maybe you’ve heard about the roaring forties, the furious fifties and the screaming sixties? That’s where we are right now… and at these latitudes (between 40-60 S) there are almost constantly strong winds from the west.
DSC_0038
The Captain anchored next to a large ice sheet and let us go for an afternoon walk!
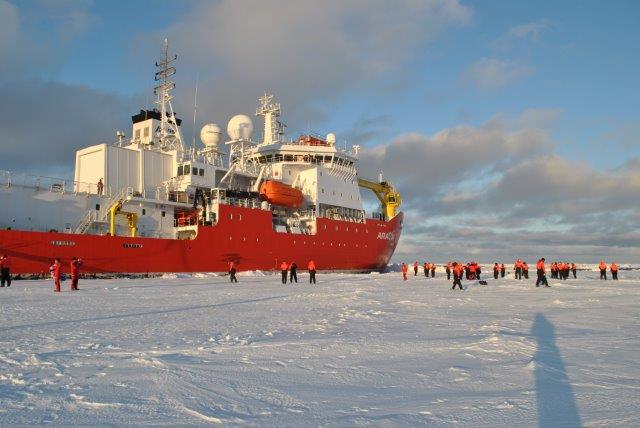
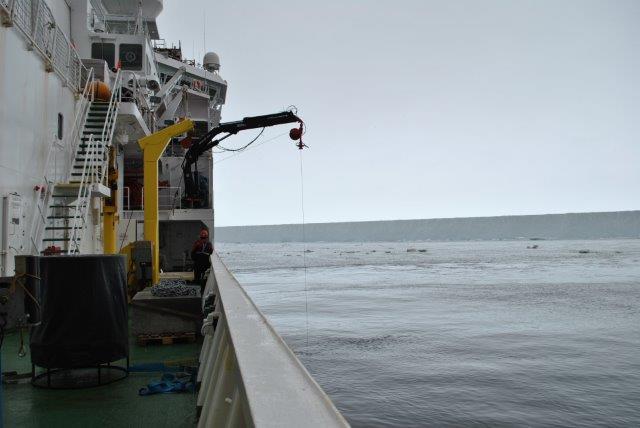
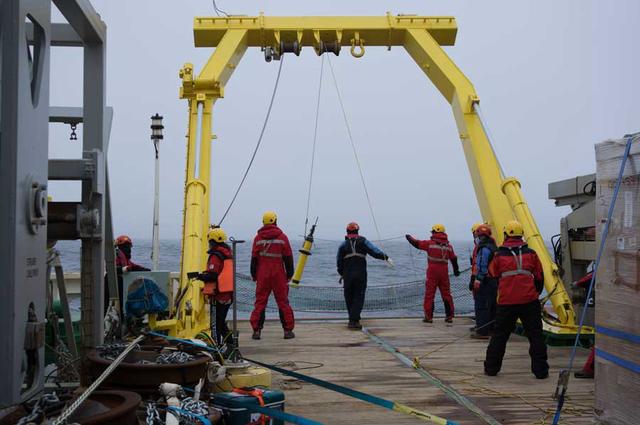
Everyone knows that if there is wind, there will be waves. And the stronger the wind, the larger the waves. The waves and the forces involved are impressive – you really do not want to be out on deck right now (and I figure that’s what the sign in Korean on the closed door tin the back is saying…)   But there is more to the wind than waves! When the wind blows over the sea surface it “pulls” on the water (the physical term is that it excerts a “stress” on the surface) in the surface and cause it to move in the direction of the wind. But the water below it, which is not (yet) moving will “pull” in the other direction (friction). If the Earth did not turn, things would have been simple: The water had moved in the direction of the wind. The speed had decreased with depth, but all of the water had moved in the same direction. But the Earth do turn – one rotation per day – and with that everything gets more complicated… and more interesting! The results of wind blowing over water is not that the water moves with the wind, but it moves perpendicular to it!
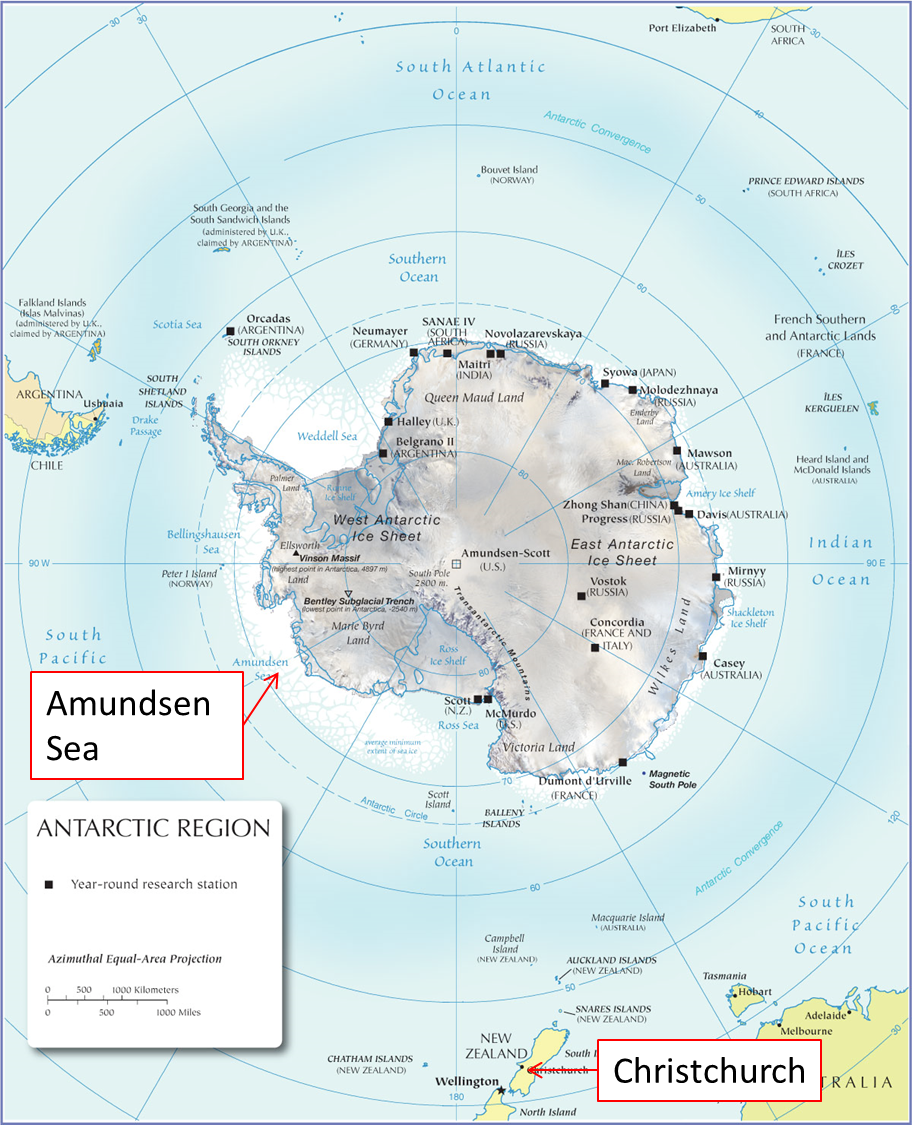
The “warm” water that invades the ice shelves in the Amundse Sea is called “Circumpolar Deep Water”  and most of it is water that sank down to the bottom of the North Atlantic a long time ago (a thousand year ago or so) and then started a slow voayage towards Antarctica. When arriving in the south, it gets caught by the Antarcic Circumpolar current, the world’s largest current which (unhindered by land)  contourns the Antarcic continent. The winds in this region causes the surfacewater in the south to move southwards, and the surface water in the north to move northward… so in the middle there is no surface water left! The surface waters are then replenished from below, the (relatively warm) deep water is pumped upward by the wind and can then flow onto the shallow (400-500 m) continental shelf in the Amundsen Sea.
DSC_0047
Korean feast!
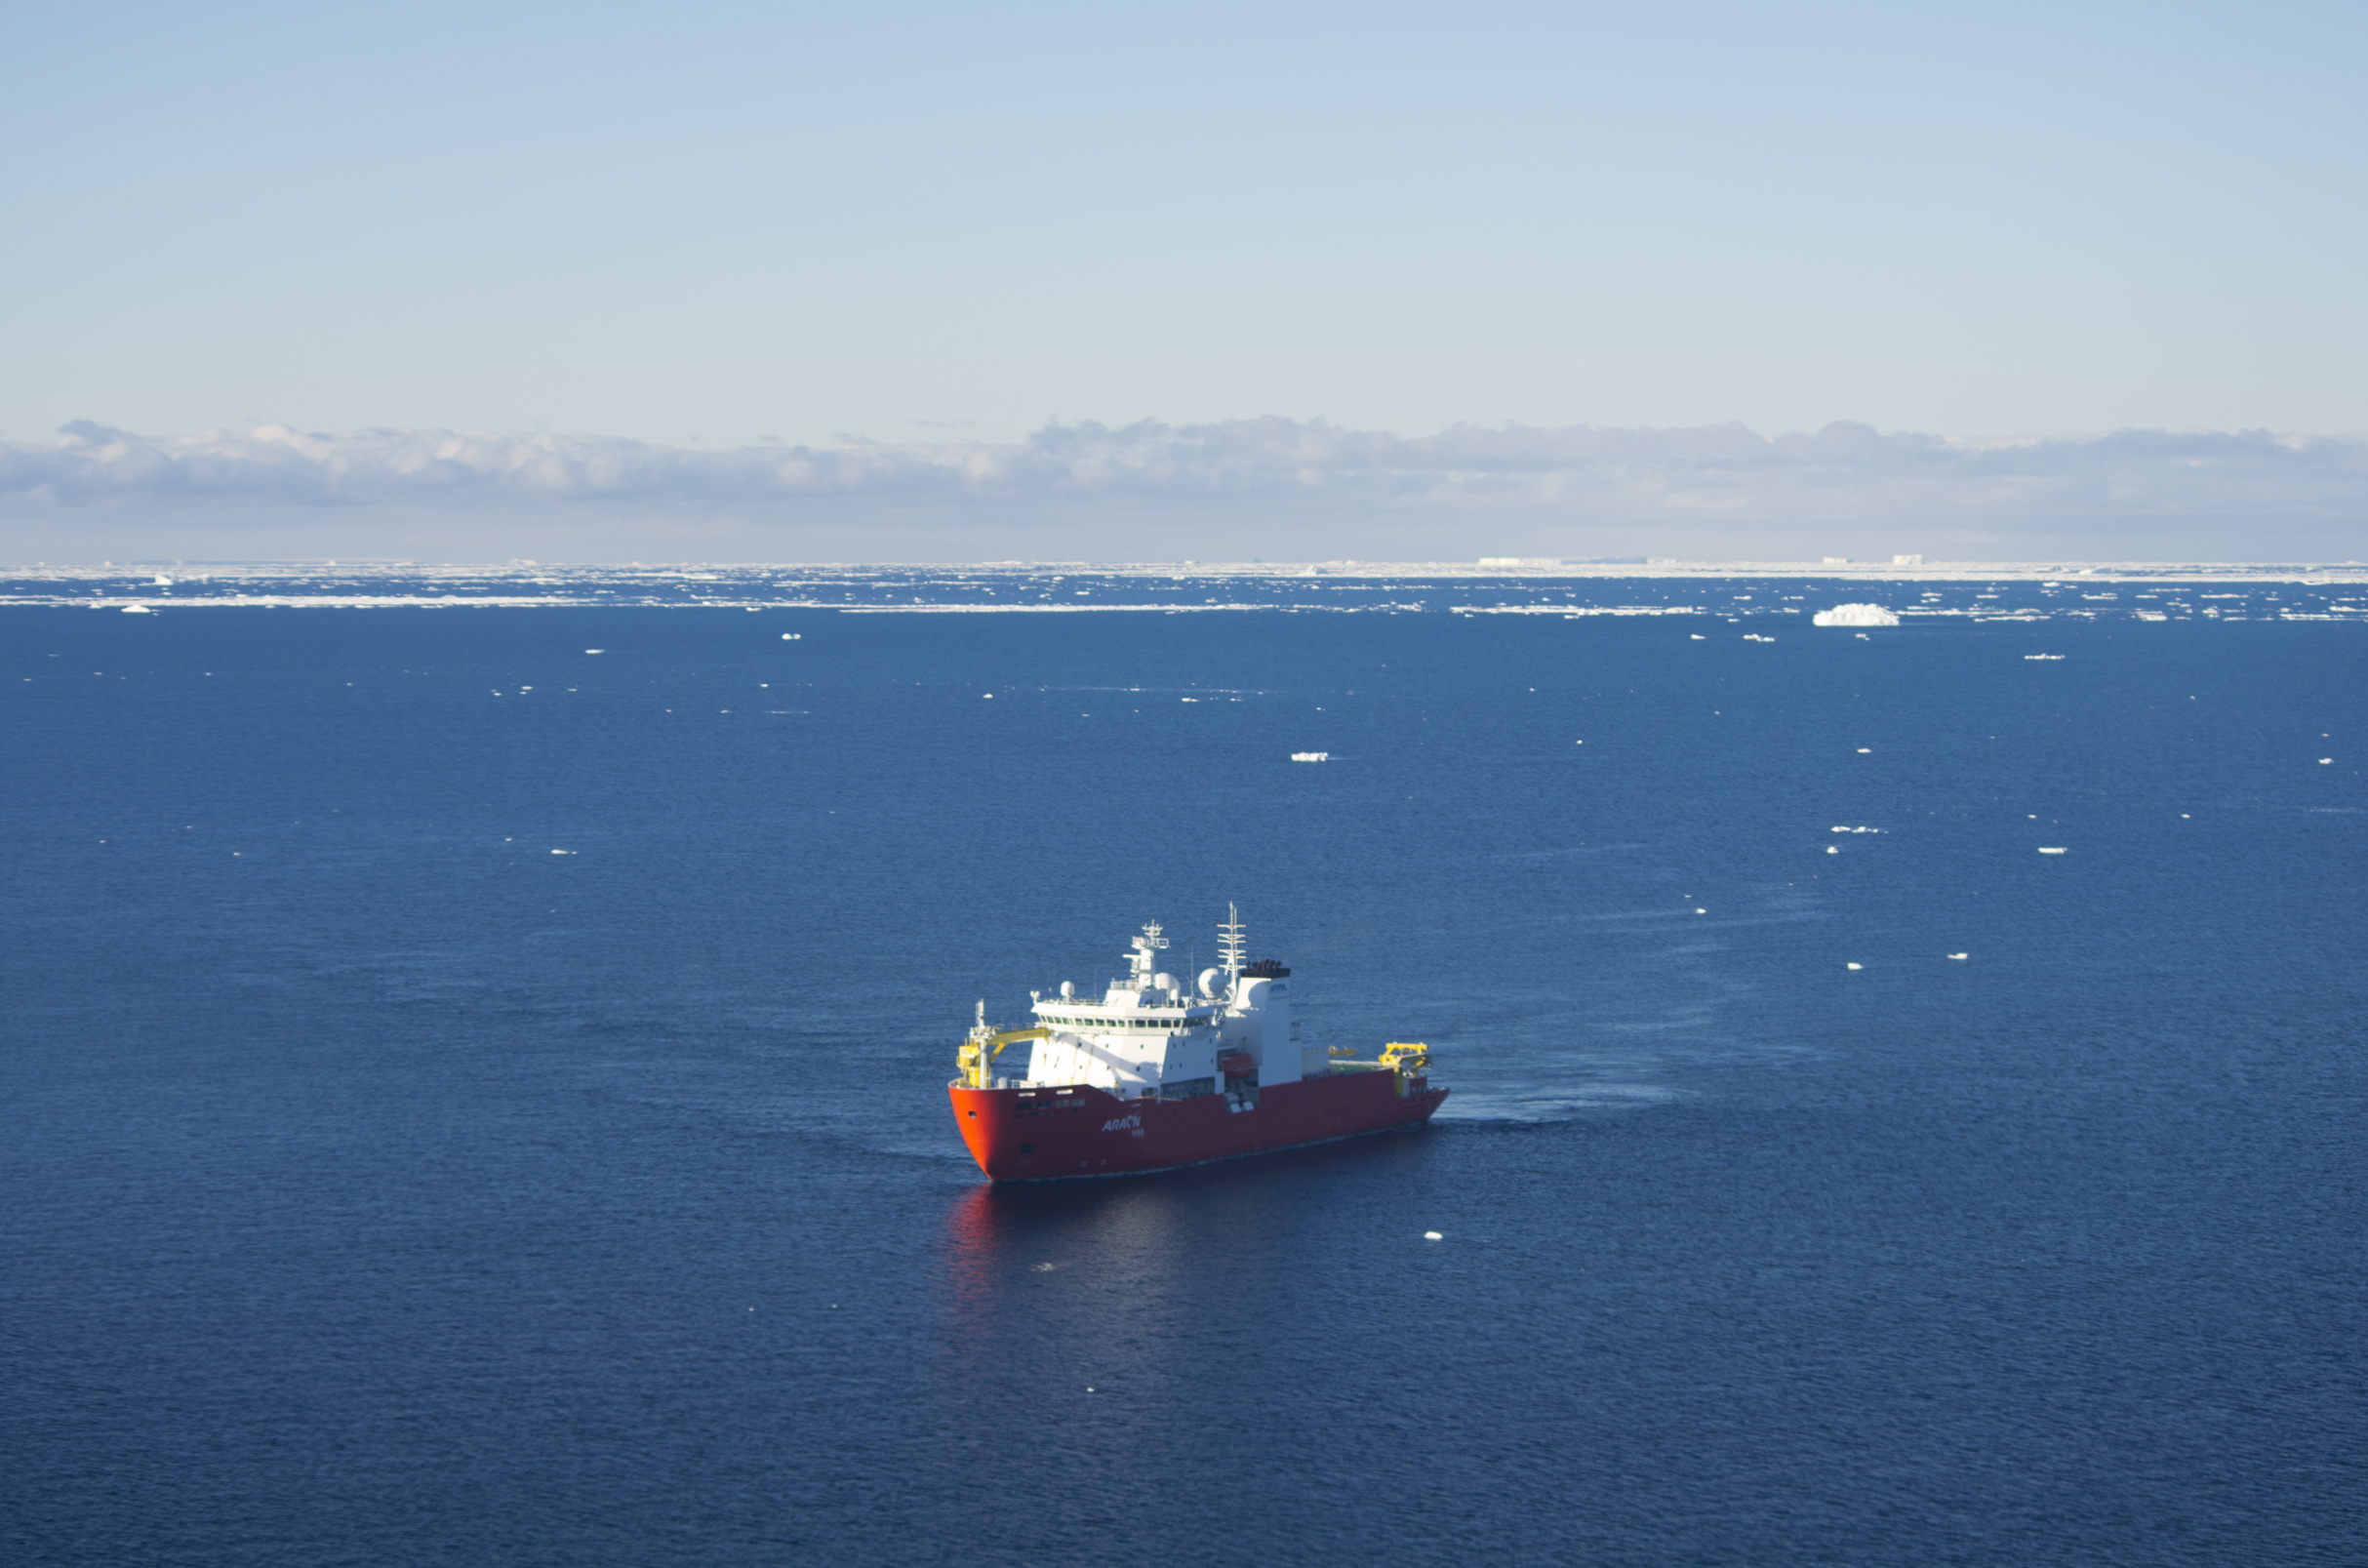
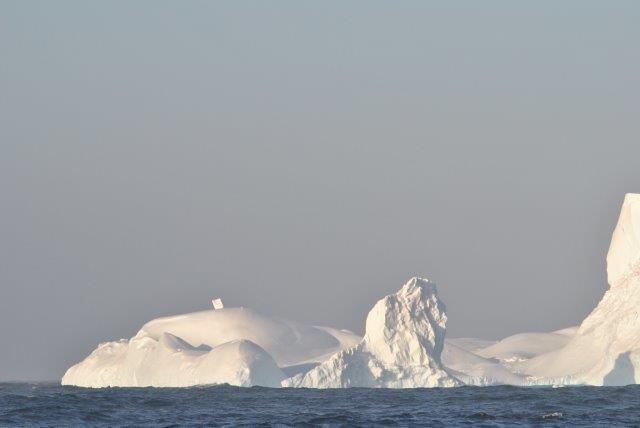
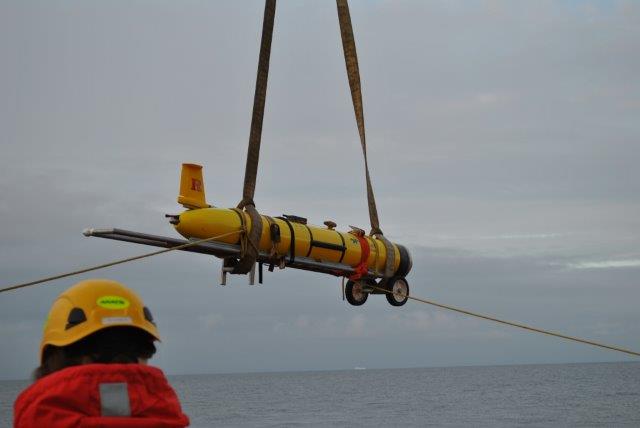
We are on our way home now and we’ve left Antarctica behing us. No more sea ice, no more penguins…. and very few ice bergs. A few of the scientist onboard are studying the eddies formed in the Antarctic circumpolar current, and their work ahs just begun… but I’m done. My instruments are in the water or up on the ice shelf* and all there is left to do is to write up the cruise report and cross our fingers that the icebergs will let the moorings be so that they are there when we come to pick them up, two years from now…
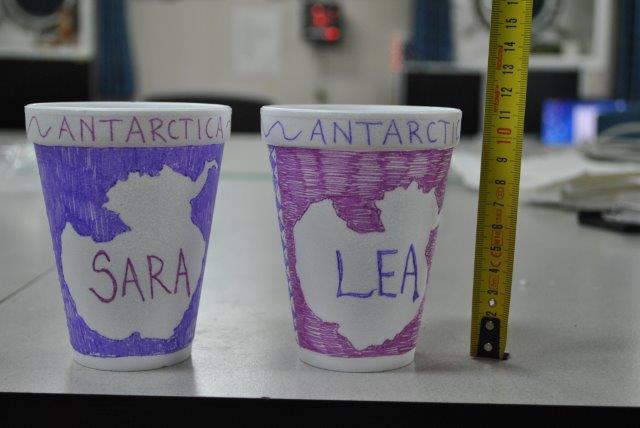
There’s still two weeks left of the cruise, and days are long now that they are not filled with work on deck. Someone brought along a bunch of styrofoam cups and (waterproof) pens, and last night was “decorate your cup night”… on one of the deeper CTD stations further north we’ll attach them to the CTD and send them down to the bottom. What do you think will happen?
DSC_0088
The cups are now 11 cm tall… how large do you think they will be when they return from a depth of 3000 m?

[slr-togglebox title=”Guess before you click here to see how the cups looked like after being lowered to 3800 m”]

DSC_0106
There is space for less coffe after the trip into the depths.

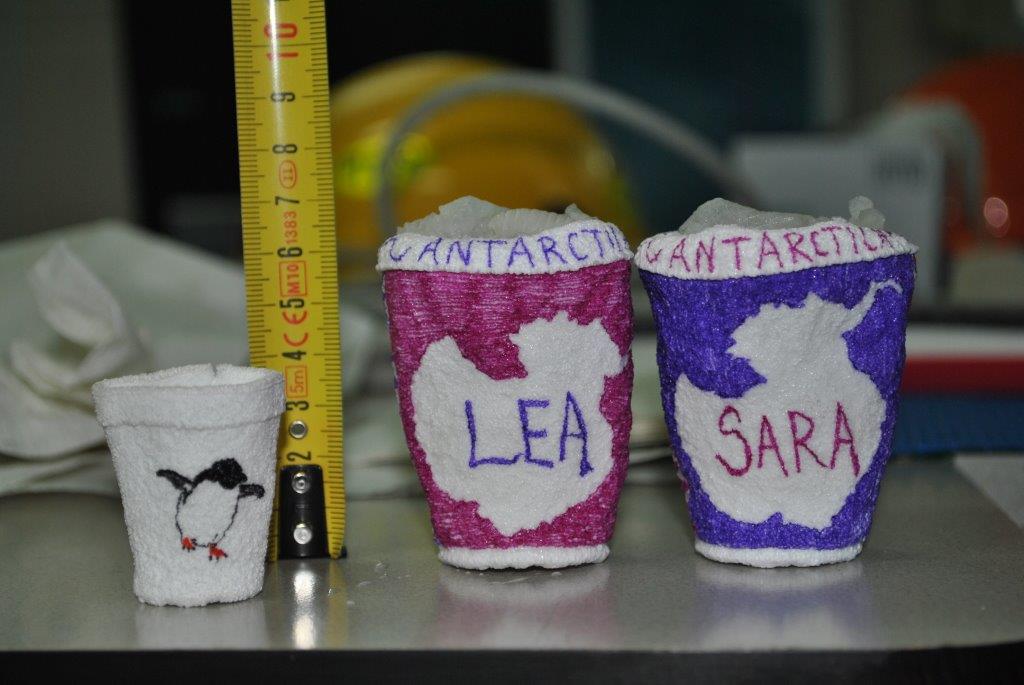
This is how the cups looked like after following the CTD to 3800 m depth! By what percentage has the volume of the cups shrunk?
[/slr-togglebox]


* We’ve installed four ice radars on the floating shelf ice – every other hour they measure the thickness of the ice below them and then we can find out how quickly the ice shelf is melting. When Karen and Povl flew out with the helicopter to install them (I was busy deploying my moorings, so I could n’t go) they also tried to determine how much sea water there is below the ice. How to do that? It is simple! (At least in theory) All you need is a (special) microphone, a metal plate and a big sledge hammer… The you hit as hard as you can with the hammer on the metal plate… and listen for the echo! The first echo is the one reflected from the bottom of the ice, and the second one is the one refelcted from the sea bed! If the first echo arrives after 0.24 s and the second after 0.4667 s, how thick is then the ice? How far is it down to the seabed? The speed of sound is 1500 m/s in water and 4000 m/s in ice. To get a better result you use more than one microphone, placed along a line with a known distance from the sound source. When does the first echo reahc the microphone placed 100 m away? When does the second one get there? Don’t forget what mr Schnell said!
DSC_0054
Korean BBQ!

Do the Math! Wind and water

Experiment: Coriolis

All the moorings in the water!

This week you’ll get a letter from my colleague Svein Osterhus who is onboard another research ship on the other side of the continent… but I thought I’d send you a short update from the Amundsen Sea and a new problem for you to solve!

6861600114_bb8d69230f_o
Foto: Povl Abrahamsen


All of my moorings are now in the water – and the nervous butterflies that have flown around in my belly the last couple of weeks are finally gone! There are so many things to prepare, so many things to think about when putting the moorings together – so many things that can go wrong. When I’ve deployed moorings before I’ve always had a technician with me, a technician who has full control over what screw goes where and where those shackles and rings are supposed to be… but this time it was me who was out on deck with a spanner in my hand trying to get everything ready in time. Finally Araon got into position and we could start!

Mr Ham, the Korean mooring technician, gave sign to the winch driver and he elegantly lifts my first orange buoy into the water. Araon is slowly advancing as we feed the mooring line out behind us. Every fifty meter or so mr Ham stops, and Karen and I attach an instrument to the line. Everything goes quick and smoothly – we all know what to do. The buoy gets smaller and smaller in the distance, and soon there is 375 m of mooring line out in the water. Only the anchor (3 old railway wheels) is left on deck, and finally it too disappears into the water with a splash. The orange buoys are pulled through the water as the anchors sinks, but eventually gravity wins and they too are gone. The anchors sinks down and lands on the bottom, normally somewhere between the location it was released and the place where the buoys are last seen. To find out exactly where the mooring is, we use the acoustic release to “triangulate”. At three positions we send down signals to the acoustic release, and based on the time it takes from the signal to come back we can calculate the distance between the hydrophone that we lower into the water to talk to the acoustic releaser and the releaser itself. Since we know where the boat is, we can determine where the releaser (and thus the mooring) is located… maybe you’d want to help out?

When the anchor to the first of my moorings were released we moved 443 m towards -40.2 degrees (see explanation of the directions in the end) and the first triangulation point. The distance to the releaser was then 802 m. Thereafter we moved 862 m towards 172 degrees and got a distance of 754 m. At the last point, the distance to the releaser was 754 m. Then we’d moved 867 m in towards 53 degrees from point number two. The depth is 600 m and the releaser is locate 25 m above the anchor. The hydrophone was lowered 10 m into the water.
Where is the anchor? How far had the anchor drifted? How exact is the triangulation? Can you estimate the error?


The deck unit talking to the acoustic release assumes a sound speed of 1497 m/s when calculating the distances. Using data from our CTD cast we calculated the true sound speed (which is a function of salinity, temperature and pressure) and found the mean speed of sound to be 1447 m/s. Does that matter for the calculations above? Can you correct for it?

The directions are given as degrees counterclockwise from the x-axis. The X-axis is pointing eastward, so if we go towards the east, the direction is 0 degrees, if we go north, it is 90 degrees and if we go south, it is -90 degrees.


Blog1_1
Foto: Elin Darelius Chiche


Do the Math! Straight lines and melting ice

Experiment: How cold can water get?

Mooring on the way up – and mooring on the way down.

With a CTD and LADCP (current meters mounted on the CTD) we can understand where the water is flowing and what its temperature is right now that we are here – but we will also be able to see what happens when we are back home already. We deploy the instruments on so-called “moorings” that stay in the ocean and measure while we are gone, and that we will come and pick up next year or the year after. I have never been in the Amundsen Sea before, so I don’t have moorings to recover right now, only new ones to deploy. But my Swedish, English and Korean colleagues do have moorings in the water – and we are getting more and more excited as we are coming closer to the position where those moorings were deployed two years ago! Karen holds a hydrophone over the railing and down into the water. Then she keys in the releaser’s special code. Far away, deep beneath us on the sea floor, the mooring waits to hear from us – and finally, now, after two years in the ocean, it can reply “here I am!”. Karen types in a second code which means “let go!”, and right away she gets the reply from the mooring: “I’ve let go, I am on my way up!”. All of us are excitedly watching the sea – keen to be the first person to spot the yellow buoy.

–       There it is! There it is!

The crew has deployed a small boat to go and fetch the mooring – they know exactly what to do, they have done it many times before.

A couple of hours later all instruments are on board and we are working hard. All data needs to be downloaded to our computers and stored to hard drives. Later, the instruments are turned over and get new batteries and software. Tomorrow they are going back into the sea!

The Koreans weren’t lucky this time round; their first mooring had broken off a bit above the sea floor and therefore they could only recover the releaser and a couple of thermometers. Their other mooring was completely gone – it was probably dragged away by a large iceberg. But the last three came up exactly as planned!

Photo: Nicole Waite
Photo: Nicole Waite

Yesterday we had a meeting with the crew and technicians to talk through what my mooring looks like and to decide how to best deploy it. The crew speaks little or no English*, therefore the meeting was held in Korean – only every now and then I was asked something in English. For almost an hour it sounded pretty much like this:

ㄻㅊ널촘ㅈ괴ㅓㄴ모거모 ㅏㄱ mooring ㅓ로ㅕ추마 ADCP ㅕ루  멍로 ㅏㅕ고러ㅏㅓ Shackleㄷ ㅣ찰머놀ㄹ러ㅏmooring 몬염ㅍ뒤곤?mooring름 ㅡㅐㅐA-frame 갸ㅜㅎ 멀촘너 .

Photo: Nicole Waite
Photo: Nicole Waite

I took my time and carefully prepared my instruments and tools – trusting that it would be several days before my moorings should go out into the water. The Koreans had four moorings that should go out first. But it got really windy and the waves got higher and higher – and the captain gave the order to stop working on deck because it was too dangerous… And this messed up the whole work schedule! We steamed westward at full speed, to the western part of Getz ice shelf. There is more ice there, and hopefully less waves, so we can use the time while the weather is bad to steam there instead of just waiting around for the weather to get better until we can deploy our moorings. So now it is all of a sudden my last mooring that shall go out right now… and therefore, I unfortunately don’t have time to write more right now!

*I asked La, one of the oceanographers who speaks excellent English, how he learned the language. All the others who speak English well did their PhDs or studies aboard – but I knew La hadn’t done that. After a while I found out that during his studies, he once a week talked in English with those people in Korea who want to talk to you in English for free: Jehova’s witness and Mormons! “But I am still a Buddhist, I just wanted to learn English and couldn’t afford a private teacher…”

Do the Math! Moorings and time series

Experiments:

Archimedes principle

What floats in the dead sea?

Alongside the ice shelf

When heading down for dinner earlier today I glanced out through my window and all I saw was a white “wall”. A white wall of ice extending to the right and the left for as far as I could see (which admittedly wasn’t very far, since it was snowing and a light mist caused the horizon to disappear). We are in front of the Dotson ice shelf, one of the smaller ice shelves in the Amundsen Sea. The biologists had a station right at the ice shelf front, and one of the plankton nets just went down into the water. How high is the wall? Ten meters? Twenty? Thirty? There was a lively discussion around the dinner table and there were plenty of guesses – but no answer, so when the dinner (squid, sweet potatoes and rice) was finished we all headed up to the bridge and asked the captain if we could borrow the sextant (Google or Wikipedia will do a better job explaining what it is than I’d do). We had a look at the radar screen while one of the deck hands searched in the cupboard for the sextant. The wall was half a nautical mile (1 nm=1852 m) away. Before we the sextant was located (and before we’d learnt how to use it) the plankton net was back on deck and we were heading to the next station. When we finally managed to measure the angle (0.77 degrees) the wall was 1.5 nm away. Now, how high was the wall? If you want to do it correctly, you also need to know that the bridge is 16.7m above sea level and the sextant was 1.5m above the floor. But does it matter if you do it “correctly”? The difference between the “correct” solution and the simplified solution is surprisingly small!

DSC_0022
One, two, three, jump! (Photo: Elin Darelius Chiche)

When Araon stops again the “wall” is still there, we are still along the front of the Dotson ice shelf. The CTD is going into the water. The
Korean oceanographers are working in shifts and there is always someone on guard in the CTD-room. This time it is Ta-wan who is placed in front of the big CTD-screen while the deck hands are preparing the winch and the CTD outside. It is snowing and the wind is rather chilly, so I decide to stay inside with Ta-wan. The radio calls for attention and I hear a few short sentences in Korean – at the same time, the screen comes to live in front of Ta-wan. The CTD has gone into the water. We wait with the CTD just below the surface until the pump has started and everything is working as it should. Then, down she goes! The data collected by the CTD is displayed “live” on the screen in front of us, and the lines grows longer as the CTD sinks down. During the first 30-40 meters the water is relatively fresh (33.9) and the temperature between 0C and 0.5C; this is the surface layer – mixed by the wind, warmed by the sun and freshened because it’s been diluted by meltwater from melting sea ice and ice bergs. When we go deeper, the salinity increases to 34.2 and the temperature sinks to -1.5C, and it then remains roughly constant for several hundreds of meters. This is “winter water”, water that has been cooled down during winter.

CTD
CTD measurements alongside the Dotson ice shelf. (Photo: Elin Darelius Chiche)

Back to the screen; the pressure sensor shows us that we’ve reached down to 400 m depth and the temperature and the salinity has started to increase. The blue line that shows the temperature is heading out of the figure, off the scale. While Ta-wan searches through the menus on the side to change the scale, the rest of us places bets on the maximum temperature. When the scale is changed and the blue line is back on the screen we learn that the winner isŠ Karen and the University of Gothenburg! The warmest water reaching the front of the ice shelf was 0.64C – this is the water we are here to study, the “circumpolar deep water” that has found its way onto the continental shelf and southward towards the ice shelf through the Dotson trough, a deep trough that the ice has carved a long time ago when the climate was colder and the Antarctic ice sheet was bigger and thicker than it is today.

The CTD has reached the bottom and we see three layers of water on the screen. Three layers, or water masses, as we oceanographer would call them. The water with the lowest density is floating on top – just like the light oil floats on top of the heavier water – and the water with the highest density at the bottom.

But enough oceanography for today – the clock has just struck eight and I leave Ta-wan and the others in the CTD-room to head to the training room and the ping-pong table. Povl ( a Danish oceanographer working at British Antarctic Survey in Cambridge, UK) and I have been challenged by Monsieur Park and Isabelle from L’Ocean in Paris, so we’ll have to stand up to defend the Scandinavian colors.

DSC_0430_LR
One of the most beautiful ice shelfs. (Photo: Elin Darelius Chiche)

Ps – while we were up playing tabletennis Nicole (from Rutgers University,US) deployed her glider. The glider can change its volume (and hence its density) and using it swings it can fly up and down through the water carrying with it a bunch of sensors – an autonomous CTD! While at the surface, it sends home data, position via satellites, and at the same time it receives new orders about where to swim, how deep to dive, what sensors to turn on etc. If you visit www.marine.rutgers.edu/cool/auvs and look for glider RU25 you can see what her glider is up to!

glider
Nicole’s glider dives into the water (the wings are not mounted yet)(Photo: Elin Darelius Chiche)

Ps 2 – Scandinavia won!


Do the Math! Salinity, temperature and density


Experiments:

Preparing a layered drink

Build your own thermometer!

How much salt is there in the ocean?

The Amundsen Sea – we are finally here!

The Amundsen Sea – we are finally here! The viw outside our round windows has changed – it is no longer only grey and blue. Between us and the horizon there’s the odd iceberg bobbing about and every now and then some sea ice and maybe a lonely snow petrell or a seal… but no penguins, just yet!

We are now quite precisely 15711 km from Bergen and home – and you proabably want to know why we came here.

The water in the Amundsen Sea is of course just as blue as the water outside Bergen – but on our oceanographic charts we tend to color it red. Red because it is (relatively) warm, red because the ice shelves are melting faster here than in most other places around Antarctica. This is not a coincidence – the ice shelves, i.e. the floating extension of the ice sheet covering the continent, are melting because the warm water is entering the cavity beneath them. And you all know what happens when you put ice in warm water.

Sjøsetting av bøye. (Foto: Povl Abrahamsen)
Undocking of a buoy. (Photo: Povl Abrahamsen)

Melting ice shelves are a big concern in the chapter of the IPCC-report that discussed sea level rise. It is a concern, because the consequences if they are to melt are so large, but the ice shelves  also represent a big question mark, because we know so little about how the work and about how they are affected by (and affect) the ocean around them. The ice shelf itself  is floating, so the sea level is not affected when it melts, but when it thins, it tends to speed  up and the glacier or ice sheet feeding it will follow. Ice is then moved from land to the ocean – and the sea level rises.

During our weeks at sea will do measurements and install instrument – both in the sea and up on the ice shelves – to better understand what is happening, and to measure the amount of heat that the ocean is transporting towards the ice shelf and how the ice shelf is responding.

A lot of the time on board is used to do “CTD-stations”. CTD stands for “Conductivity-Temperature-Depth, and it is a bunch of sensors mounted on a frame (most of the time with a number of bottles attached to it) that we lower down to the ocean using a big winch. On its way down to the bottom the CTD is continuously measuring and sending the data back to us.  On the screen in front of us a profiles show how salinity and temperature is changing as the instrument moves downward. The “bottles” on the frame are open in both ends so the water is flowing through them and when the CTD is returning up to the surface we stop it every now and then to close one of the bottles – in that way we can bring water from different depths up, that we (or the biologists onboard) can analyze.

Skipets laboratorium har mye utstyr. (Foto: Povl Abrahamsen)
There is a lot of equipment at the lab. (Photo: Povl Abrahamsen)

A few hours ago we took the first CTD-station and the instrument was sent down to the bottom 3450 m below us. We are still above deep water, and we will continue to do CTD-stations on our way in towards the shallow continental shelf. Down in the deep there is plenty of “warm” water, the big question is how much of it that makes it up on the continental shelf, in towards the floating ice.

We are now getting used to life onboard… we’ve learnt what buttons to press to make the Korean laundry machine start, I’ve learnt to stay away from the red (and thus spicy) food and we’ve made the bread baking a routine! My colleague Anna (from Gothenburg University) has been onboard Araon on previous expeditions, and after spending eight weeks at sea with no real bread last time she was on board, she decided  to bring a bread machine (and 25 kilos of flour!). The Koreans normally don’t eat bread, but when the smell of freshly baked bread is spreading in the corridors they are eager to come and taste!

Et historiske øyeblikk! Det første brødet bakt på Araon skjæres opp. (Foto: Povl Abrahamsen)
An historical moment! We cut up the first bread baked on Araon. (Photo: Povl Abrahamsen)
Koreansk barbecue serveres på lørdagar. Ukens kulinariske høydepunkt. (Foto: Povl Abrahamsen)
Korean barbecue on the menu on saturdays (Photo: Povl Abrahamsen)


Do the Math! Oceanic heat and melting ice

Experiment: How much salt is there in the ocean?

Ice or no ice

It’s early in the morning and I’m alone out on the deck. Far away the blue sea mixes with the grey sky and forms a blurry horizon. It doesn’t matter in what direction I look, it is all the same: grey and blue. Araon that appeared so large back in the harbor is now a small red dot in a seemingly eternal blue  ocean. Araon is a Korean icebreaker that during this expedition to Antarctica and the Amundsen Sea brings along about 40 scientist: biologist, chemists, meteorologists and a group of physical oceanographers. I belong to the latter; I’m a physical oceanographer. That means that I try to find out how the ocean works – where do the currents go and why? In a way it’s like meteorology, but in the ocean. I boarded Araon more than a week ago in Christchurch, new Zealand  in order to – when we finally get there – deploy instruments on the continental shelf around Antarctica.

Araon i hamnen utanför Christchurch, Nya Zealand. Här blev vi liggande längre än planerat på grund av motortrubbel.
Araon in the harobur of Christchurch, Nya Zealand. Our stay here was prolonged due to trubble with the engines.
We were supposed to be down there by now, in the ice – but an hour or so before we were set out on New year’s eve they discovered a leak in the engine so the departure was delayed and we couldn’t do much but hang out and wait for the technician’s to repair and fix the problem.
Most of the ice cover around Antarctica is seasonal, that is it grows during winter and melts away during summer – compared to the Arctic there is very little ice that survives the summer (You can read more about the differences between sea-ice in the Arctic and Antarctica here: https://nsidc.org/cryosphere/seaice/characteristics/difference.html, but close to the continents the ice remains. You can see how much ice there is around Antarctica here: http://www.iup.uni-bremen.de:8084/amsr2/  (The pictures from Antarctica is at the bottom of the page Antarctic).
Sea ice is not only beautiful but also important. It is crucial for the marine biology (everything from large seals to small algae lives on or in it), for the ocean below it (it isolates the ocean from the cold atmosphere and influences the properties of the seawater below by separating the fresh water from the salt) and for our climate, since the white ice will reflect the incoming solar radiation while the dark ocean absorbs it.
But the best thing about ice (at least in the opinion of a sea sick oceanographer), is that it effectively “kills” the waves… right now, there are quite big waves and the ship is rolling back and forth, back and forth, back and forth. We are crossing over the Southern ocean, and there is a reason why one tend to talk about “the roaring forties, the furious fifties (where we are now) and the screaming sixties…  All equipment has to be secured and tied down, if not it would be flying around. I was up more than once this night to pick up things that were rolling around on the floor. My stomach is also “rolling”, and I didn’t manage to eat very much of the Korean breakfast: soup, fried small (3-4 cm long, you eat the head and everything!) fish and egg, and then off course rice. The breakfast looks much like lunch and dinner!
Mitt rum under kommande sju veckorna. Jag delar hytt med Isabell från Frankrike.
My room the next seven weeks. I share cabin with Isabell from France.

On our way to the Amundsen Sea we will make a detour for our French colleagues who are studying the Antarctic circumpolar current- that is the strongest current in the world! Next week I’ll tell you more about why we are going to the Amundsen Sea and what we will do there… but until then, try to do the exercises and learn more about how the ice grows. I hear it is cold back in Bergen, so maybe you’ve got more ice around than I do…

Karta över Antarktis. Nya Zealand ligger längst ner till höger!
Map of the Antarctic region. New  Zealand at the bottom to the right!

Do the Math! Ice

Experiment: Melting ice cubes