…on the radio!
Those of you who understand Swedish (or is it “Svorsk”?) can listen to me trying to explain what we do in Antarctica to a Swedish journalist here: Radio Halland

…on the radio!
Those of you who understand Swedish (or is it “Svorsk”?) can listen to me trying to explain what we do in Antarctica to a Swedish journalist here: Radio Halland
It took a bit longer than I expected – but here we go – my* latest “baby” is available online!
You can read the full version of the paper here:
https://agupubs.onlinelibrary.wiley.com/doi/abs/10.1002/2017GL076320
or a summary below!
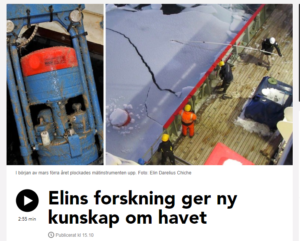
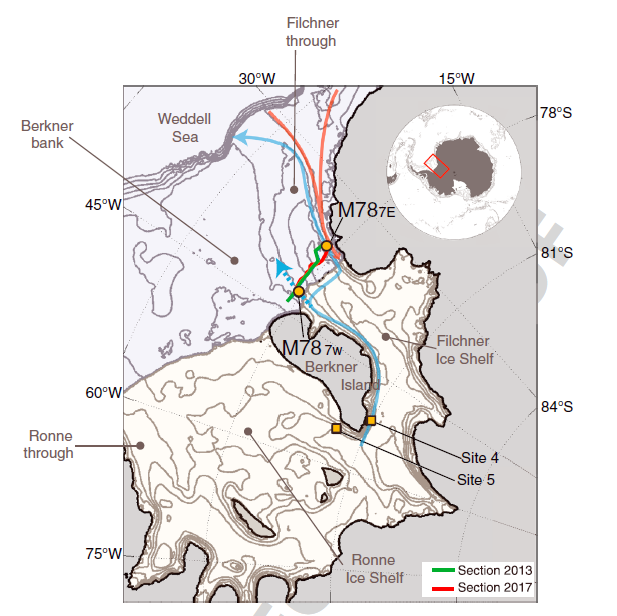
In February last year we recovered a mooring at the Filchner Ice Shelf front (See map below) that we since long had consider lost. The large German ice-breaker Polarstern had failed to reach it twice due to sea ice, and it had now been in the water for more than four years. When we reached the location with (the much smaller) JCR last year, the mooring was only a few hundred meters from the advancing ice shelf front, and the captain was somewhat hesitant to go there – but he did, and the acoustic release on the mooring SA responded and released as promptly as if it had been deployed the day before! Most of the instruments had run out of battery and thus stopped recording – but one of them were still running, providing a four year long data record!
The mooring had several temperature and salinity sensors, and the records from them showed that there is a pulse of very cold (-2.3C!) ice shelf water (see explanation below) leaving the cavity during late summer and autumn each year. The water has been cooled down so much through interaction with the ice shelf base at depth, that there are ice crystals forming within it as it rises and leaves the cavity (I’ll write about what the ice crystals did to our instruments in a later post). The salinity of the cold water was relatively high – telling us that the water most likely entered the ice shelf cavity in the Ronne Depression, west of Berkner Island (see map).
In an earlier paper**, we had shown (using a numerical model) that ice shelf water flowing northward along the Berkner island would turn east when it reaches the ice shelf front (because conservation of potential vorticity hinders water to flow across the ice shelf front where the water depth suddenly changes by hundreds of meters) and exit the cavity in the east. But now the data showed that water was exiting the cavity in the west anyway?! What about the potential vorticity?? Our data also show that when cold water is flowing out of the cavity in the west during late summer, there is layer of less dense (and warmer) water present above it. In the paper we suggest that the presence of the upper, lighter layer breaks the potential vorticity constraint. The layer of less dense water reaches down roughly as deep as the ice shelf itself – and you can imagine that to the outflow it acts as a continuation of the ice shelf.
We now know that water leaves the ice shelf cavity also in the west – but where does it go then? Is there a flow of dense ice shelf water also along the western part of the Filchner trough?
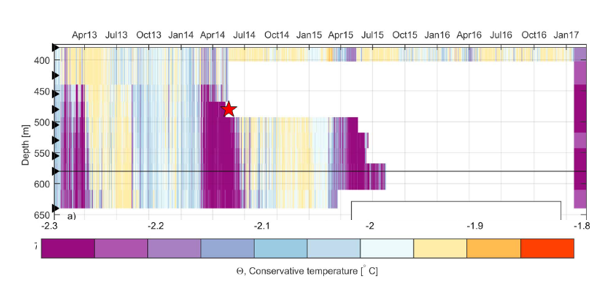
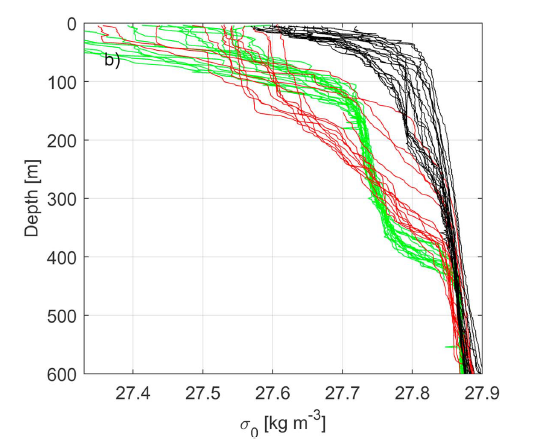
Ice shelf water: We define water that has a temperature below the surface freezing point (which is about -1,9C for sea water) as “ice shelf water”. The water leaving the cavity was as cold as -2.3C (See figure 2 above)! How can it be so cold? It is a combination of two physical facts: 1) The freezing point decreases as pressure increases and 2) water in contact with ice will have a temperature equal to the freezing point. In an ice shelf cavity we have ice in contact with water at large depth ( i.e. at large pressure) and the water will then be cooled down (the heat given off by the water is used to melt ice) to the local freezing point – and voila, you’ve got ice shelf water!
* I say my, but it’s a team effort: many thanks to J.B. Sallée who co-authored the paper and to all the people involved in deploying and recovering the moorings!
**Darelius, E., Makinson, K., Daae, K., Fer, I., Holland, P. R., & Nicholls, K. W. (2014). Circulation and hydrography in the Filchner Depression. Journal of Geophyscial Research, 119, 1–18. http://doi.org/10.1002/2014JC010225
As scientists it’s not enough to only do research alone in our little office, but we also need to get among other scientists to find out what new research is being done, to network and to make other’s aware of our important piece of work. Each year, there is a big European geoscience conference (EGU) in Vienna which again took place last week. 15000 scientists attended from more than 100 different countries and I (Nadine) was among them! In my luggage: A poster presenting our experiments at the Coriolis platform and some first results. This was very exciting, because it is a unique opportunity to talk to other scientists doing similar research. I was even co-convener in a session about the Southern Ocean which means I got to pick the talks and helped preparing everything in advance! After that week I was very exhausted, but happy! The program was stuffed with interesting talks and posters about Antarctica, oceanography, ice shelves, ice shelf—ocean interaction and glaciers and I got to talk to many skilled, interested and motivated scientists. All of them loved our experiments on the water-filled mary-go-round!
Writing a scientific article is a long process – you collect the data, you calibrate them, process them and you analyze them. You plot them, think about them, discuss them, think about them again until hopefully, at some point, the data give you results that you can understand and – publish. So you write the paper – in between meetings and teaching you somehow manage to squeeze your outstanding results and neatly prepared figures into the template provided by the journal. Then you submit – and forget about it all until you hear back from the editor three months later: the REVIEWS are back… sometimes it’s like this:
i.e. you quickly find out that your results were not that outstanding and your figures not that neat… the reviewers have filled page after page with “Did you consider…”, “why didn’t you calculate…” how does this compare to..”, “can you really ignore the effect of….” and “you ought to refer to the paper by mr so and so”…so you start over, you do all the extra analyses that reviewer three asked for, you make new figures, you clarify and expand and include a citation of mr so and so (the reviewer?). You read and write the text over and over and at some point you realize that you’ve done all that they ask for… and that version 6.2 of the paper is indeed much better than version 1.0. So you write a very polite letter to the editor, where you respond to each and every comment from the reviewers and explain what you’ve changed – and then you resubmit. And you wait. Again. For three months.
… but then sometimes, you get three short lines from the editor stating that you paper is accepted! It will be published!!! YES!!!
I received one of these e-mails the other day – and once the paper get online in a couple of days I’ll let you know what it is all about!