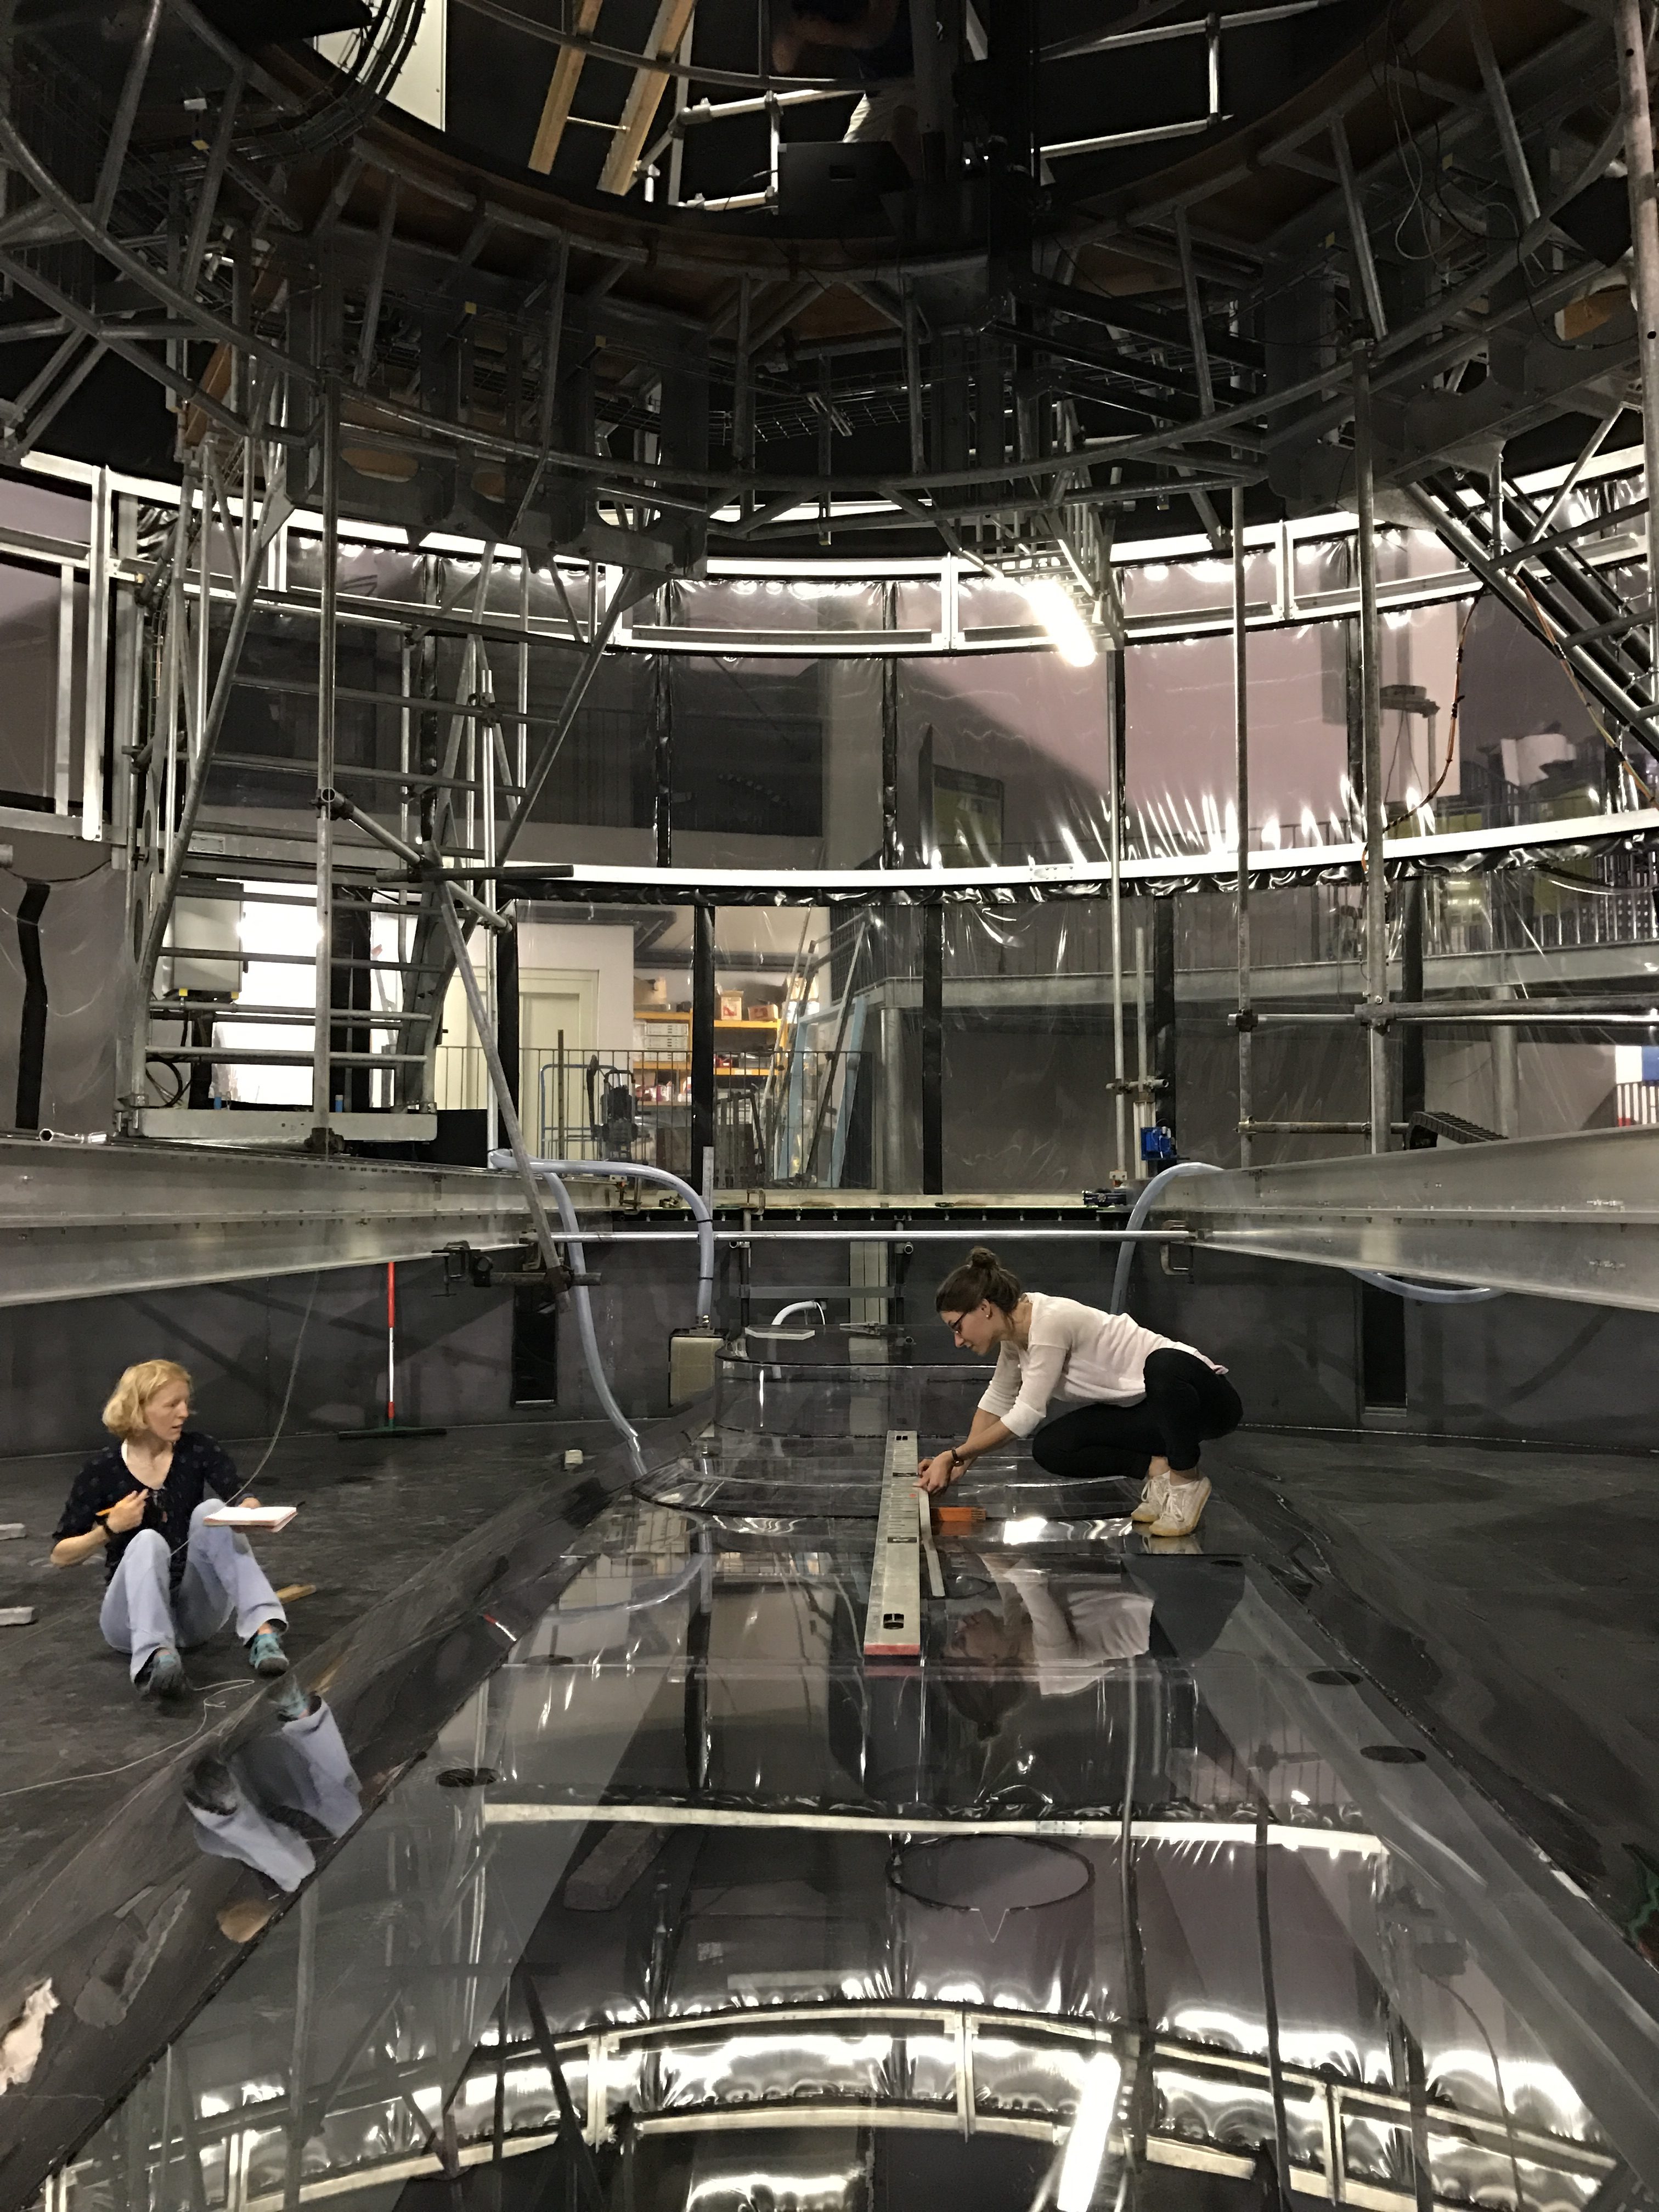
Elin and her team are reporting from a 13-meter-diameter rotating swimming pool in Grenoble! Below you see a picture from our first day in Grenoble: No water in the tank yet, and it is not rotating yet, either. But come over to the new blog and and read all about our scientific adventures there! 🙂
The wind is strong and the waves are high. The ship is rolling, up and down, up and down… It is difficult to walk straight down the hall way and we hold tight to the hand rails when walking down the stairs for dinner. I do hope they are not serving soup…
Maybe you’ve heard about the roaring forties, the furious fifties and the screaming sixties? That’s where we are right now… and at these latitudes (between 40-60 S) there are almost constantly strong winds from the west.
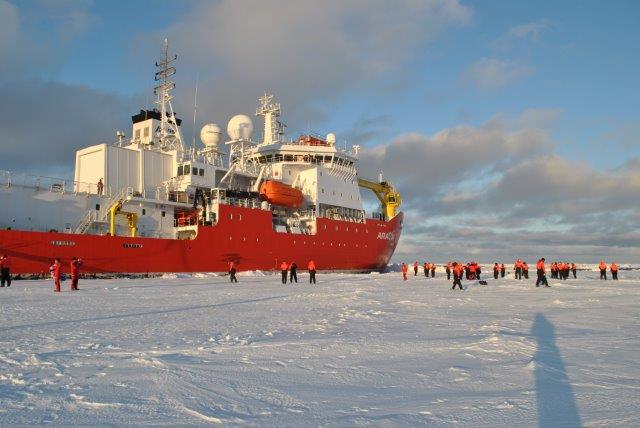
The Captain anchored next to a large ice sheet and let us go for an afternoon walk!
Everyone knows that if there is wind, there will be waves. And the stronger the wind, the larger the waves. The waves and the forces involved are impressive – you really do not want to be out on deck right now (and I figure that’s what the sign in Korean on the closed door tin the back is saying…) But there is more to the wind than waves! When the wind blows over the sea surface it “pulls” on the water (the physical term is that it excerts a “stress” on the surface) in the surface and cause it to move in the direction of the wind. But the water below it, which is not (yet) moving will “pull” in the other direction (friction). If the Earth did not turn, things would have been simple: The water had moved in the direction of the wind. The speed had decreased with depth, but all of the water had moved in the same direction. But the Earth do turn – one rotation per day – and with that everything gets more complicated… and more interesting! The results of wind blowing over water is not that the water moves with the wind, but it moves perpendicular to it!
The “warm” water that invades the ice shelves in the Amundse Sea is called “Circumpolar Deep Water” and most of it is water that sank down to the bottom of the North Atlantic a long time ago (a thousand year ago or so) and then started a slow voayage towards Antarctica. When arriving in the south, it gets caught by the Antarcic Circumpolar current, the world’s largest current which (unhindered by land) contourns the Antarcic continent. The winds in this region causes the surfacewater in the south to move southwards, and the surface water in the north to move northward… so in the middle there is no surface water left! The surface waters are then replenished from below, the (relatively warm) deep water is pumped upward by the wind and can then flow onto the shallow (400-500 m) continental shelf in the Amundsen Sea.
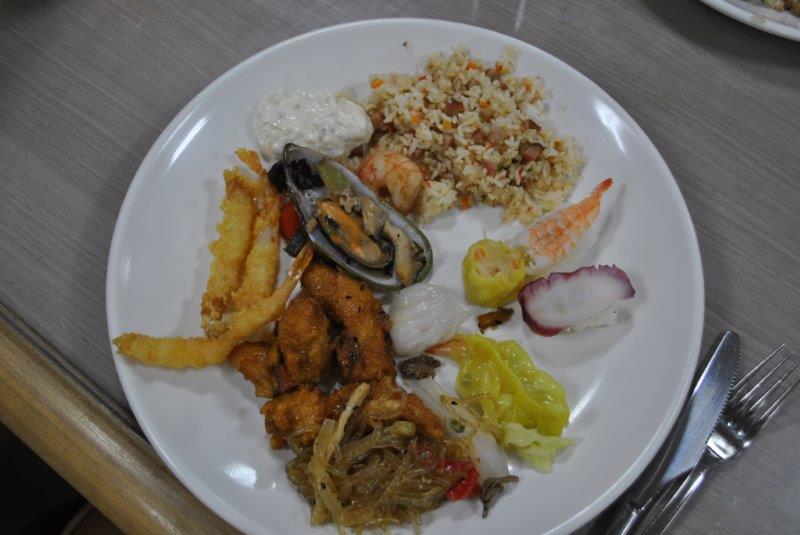
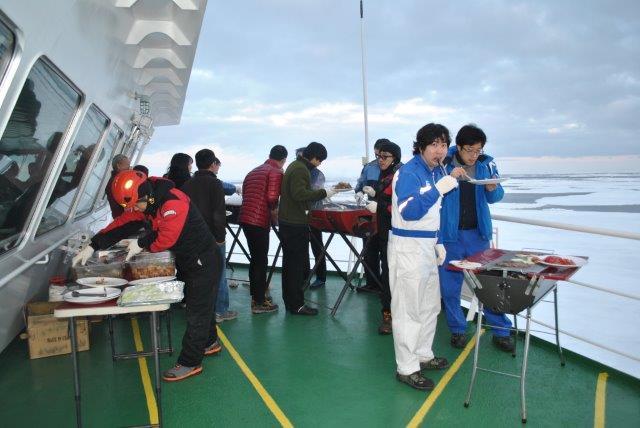
Korean feast!
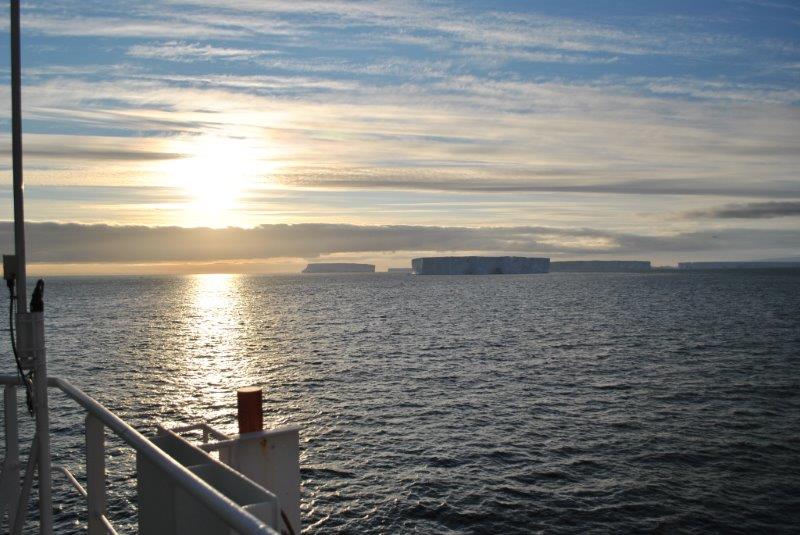
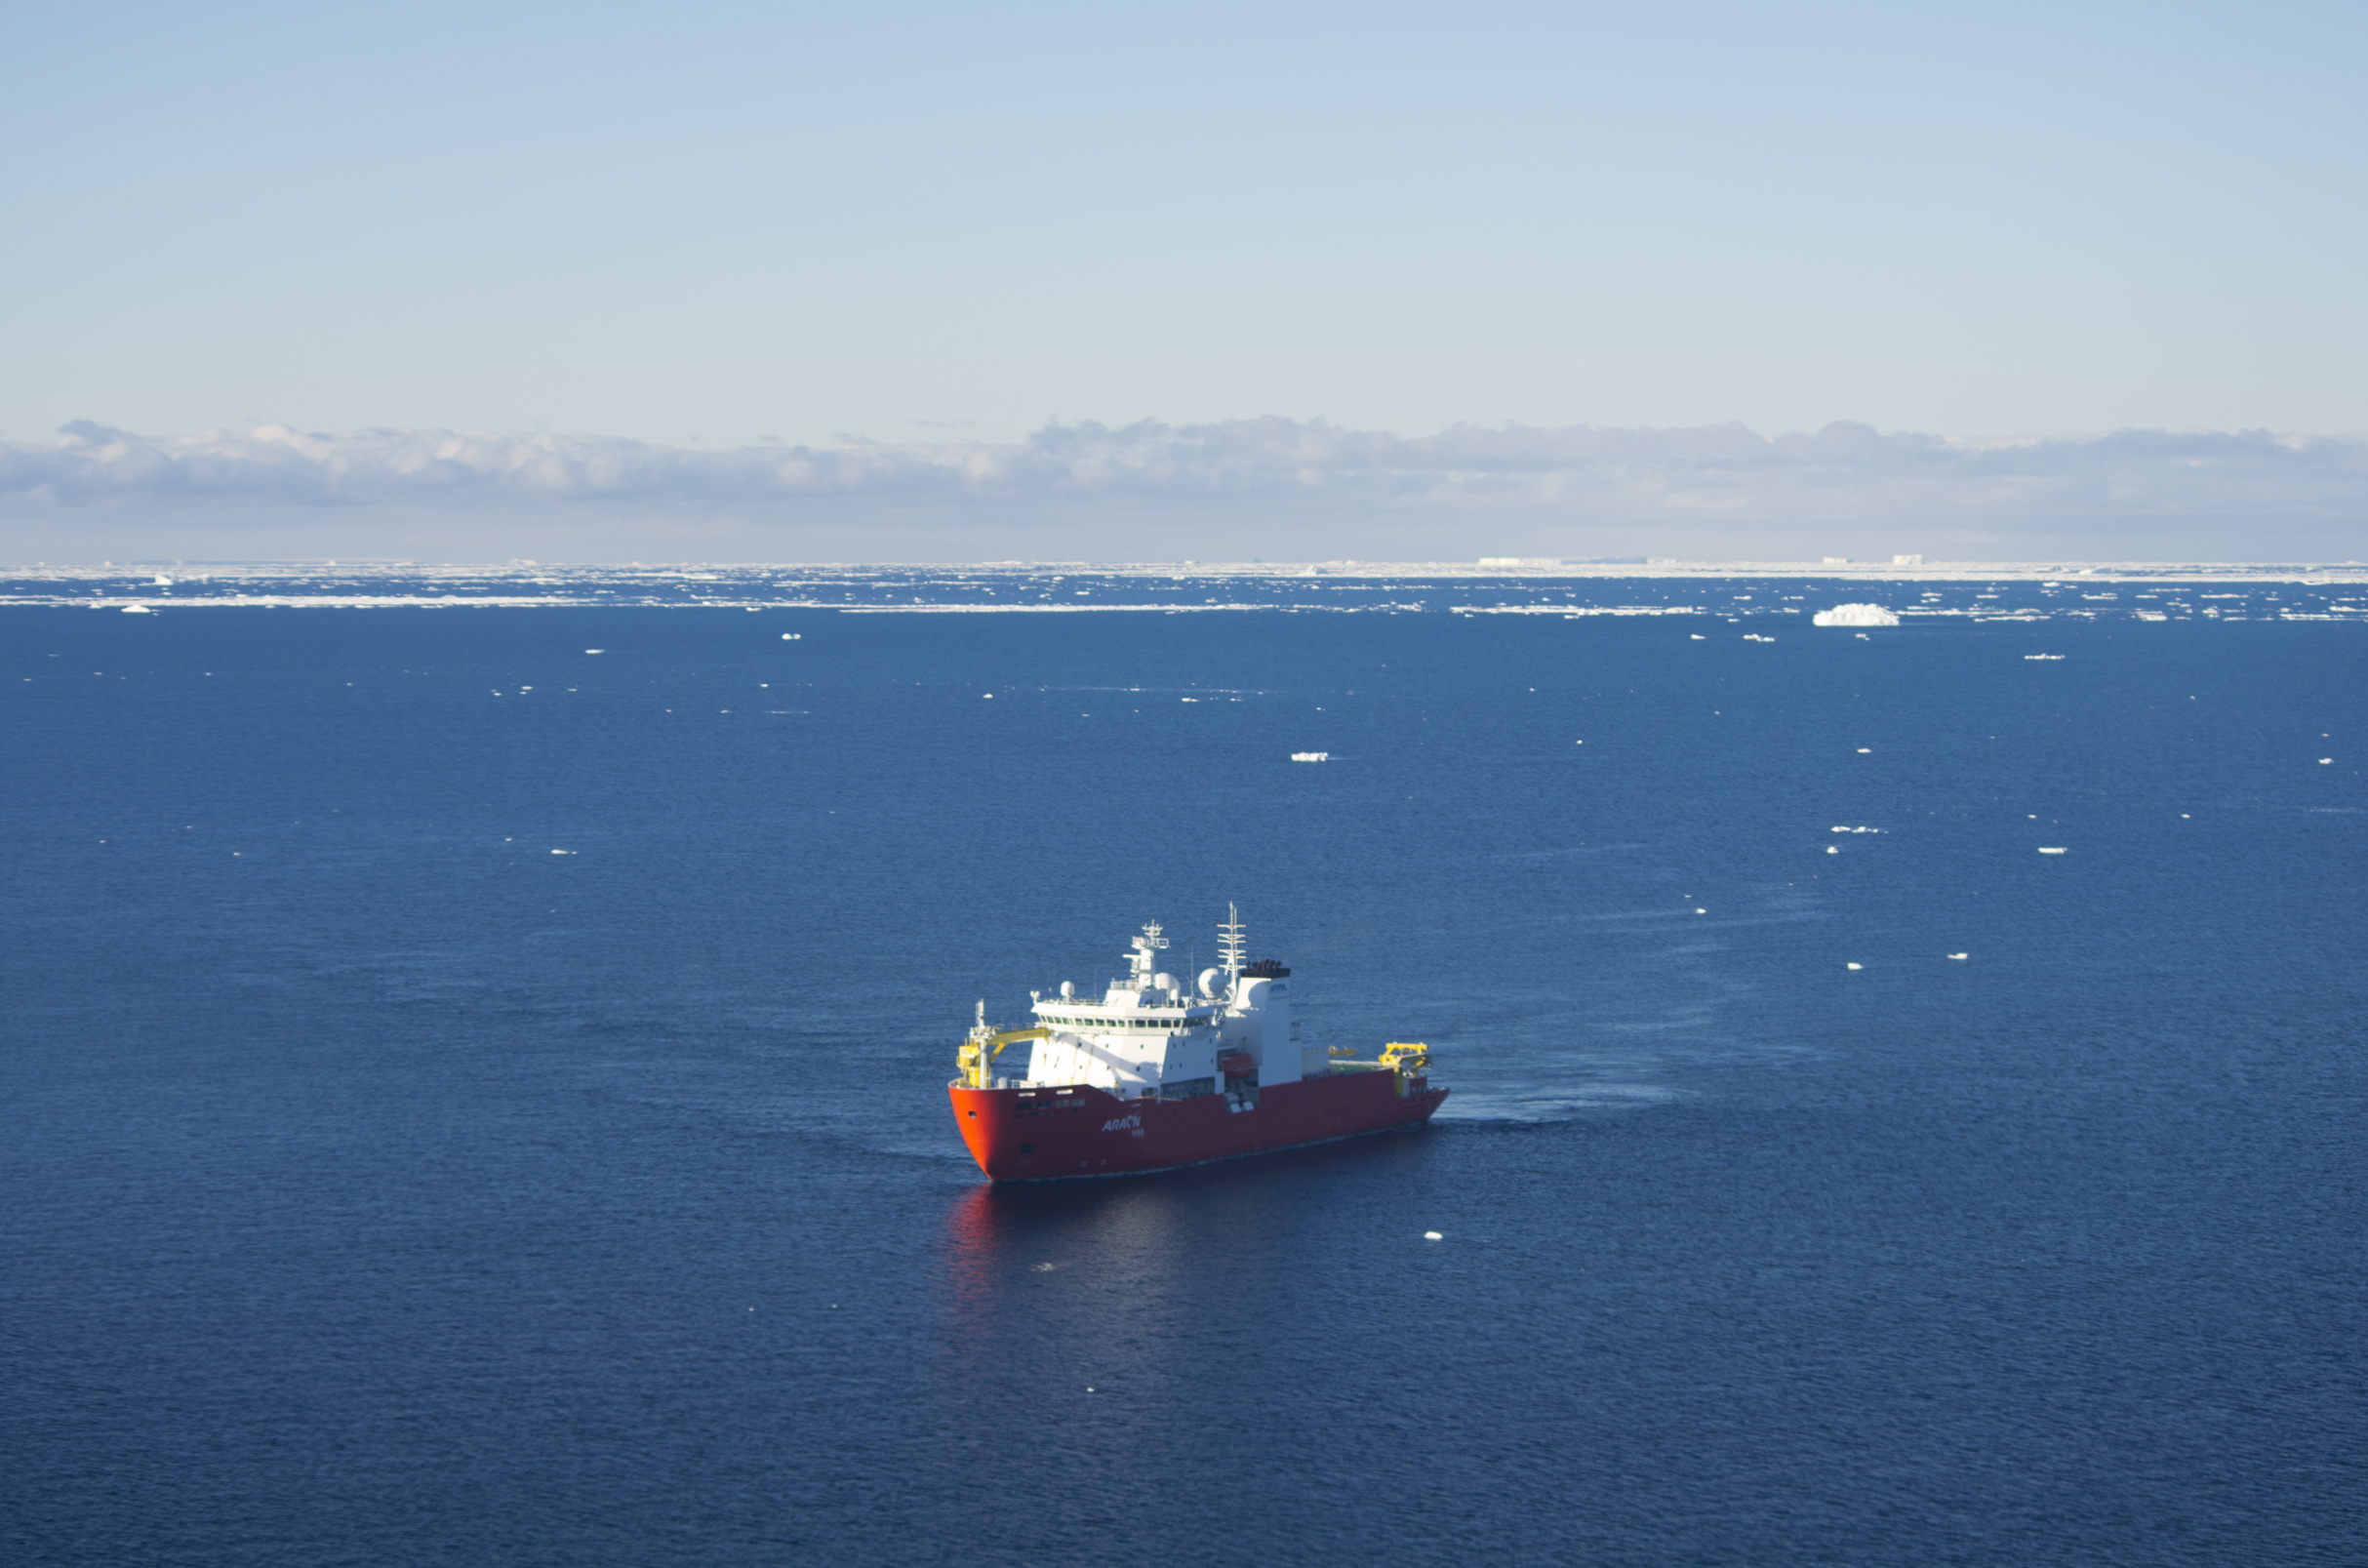
We are on our way home now and we’ve left Antarctica behing us. No more sea ice, no more penguins…. and very few ice bergs. A few of the scientist onboard are studying the eddies formed in the Antarctic circumpolar current, and their work ahs just begun… but I’m done. My instruments are in the water or up on the ice shelf* and all there is left to do is to write up the cruise report and cross our fingers that the icebergs will let the moorings be so that they are there when we come to pick them up, two years from now…
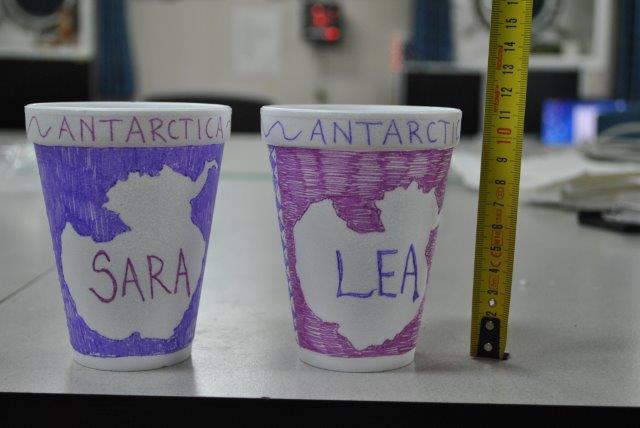
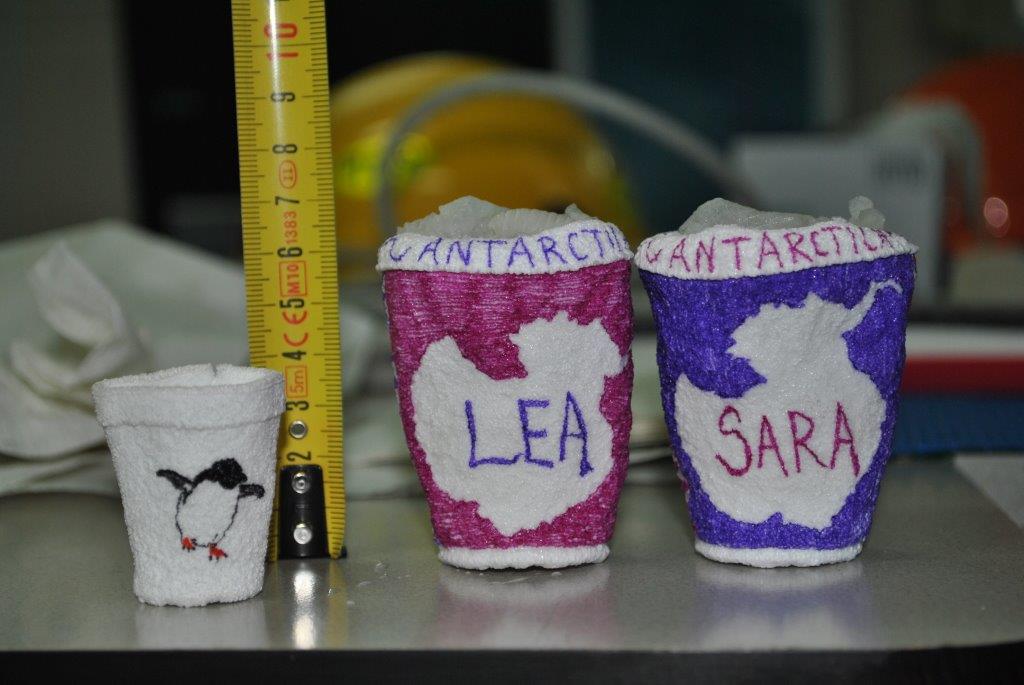
There’s still two weeks left of the cruise, and days are long now that they are not filled with work on deck. Someone brought along a bunch of styrofoam cups and (waterproof) pens, and last night was “decorate your cup night”… on one of the deeper CTD stations further north we’ll attach them to the CTD and send them down to the bottom. What do you think will happen?
The cups are now 11 cm tall… how large do you think they will be when they return from a depth of 3000 m?
[slr-togglebox title=”Guess before you click here to see how the cups looked like after being lowered to 3800 m”]
There is space for less coffe after the trip into the depths.
This is how the cups looked like after following the CTD to 3800 m depth! By what percentage has the volume of the cups shrunk?
[/slr-togglebox]
* We’ve installed four ice radars on the floating shelf ice – every other hour they measure the thickness of the ice below them and then we can find out how quickly the ice shelf is melting. When Karen and Povl flew out with the helicopter to install them (I was busy deploying my moorings, so I could n’t go) they also tried to determine how much sea water there is below the ice. How to do that? It is simple! (At least in theory) All you need is a (special) microphone, a metal plate and a big sledge hammer… The you hit as hard as you can with the hammer on the metal plate… and listen for the echo! The first echo is the one reflected from the bottom of the ice, and the second one is the one refelcted from the sea bed! If the first echo arrives after 0.24 s and the second after 0.4667 s, how thick is then the ice? How far is it down to the seabed? The speed of sound is 1500 m/s in water and 4000 m/s in ice. To get a better result you use more than one microphone, placed along a line with a known distance from the sound source. When does the first echo reahc the microphone placed 100 m away? When does the second one get there? Don’t forget what mr Schnell said!
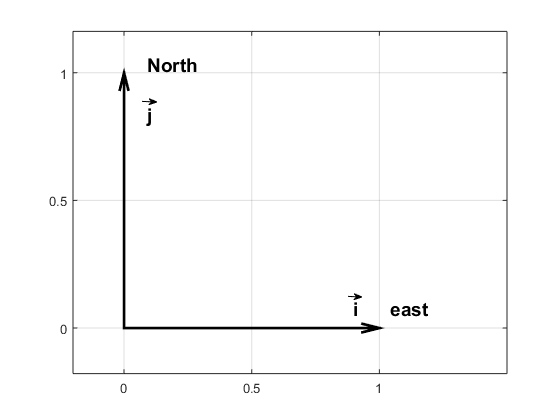
Wind and currents have a strength and a direction and therefor use vectors to represent them, for example: \(\vec{u}=u\vec{i} + v\vec{j}\). \(\vec{i}\) and \(\vec{j}\) are unit vecors pointing towards east and north (see figure) while \(u\) and \(v\) gives the length of the vectors or the strength of the current in that direction If the wind blows towards the north with 10 m/s we have \(\vec{u}=10\vec{i}\); if it blows towards south \(\vec{u}=-10\vec{i}\); and if it blows towards the northeast we get \(\vec{u}=7.1\vec{i}+7.1\vec{j}\).
Unit vecorihas length 1 and point to the east. The unit vector j has length 1 and points to the north.
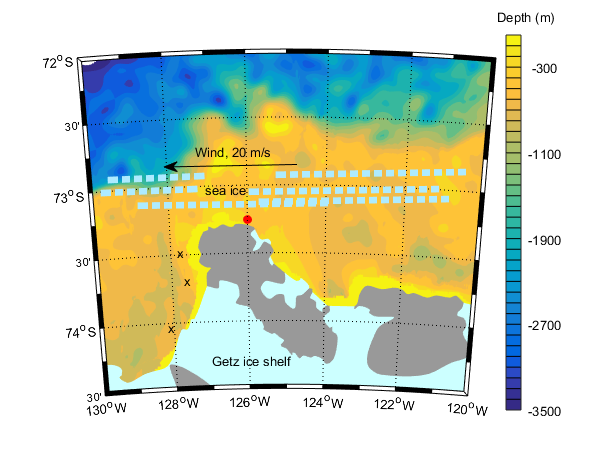
The ice conditions change constantly due to wind and currents – so the captain must follow the evolution through e.g. satellite images so that we don’t get “caught” by the drifting ice. (Araon is an ice breaker, but breaking ice is slow and very fuel consuming) . The sea ice is realtively thin and its motion is most affected by the wind – a rule of thumb is that the ice more with about 2% of the speed of the wind and about 30 degrees to the left of the wind (in the north it moves to the right of the wind).
Exercise 1
The wind is blowing 20 m/s towards the west and the drifting ice is 5 km from land.
a)Express the motion of the wind and the ice on vector format
b) How far southward will the ice move in an hour?
c) How fast does Araon have to drive to make past the peninsula to the moorings on the other side before the ice closes the passage? Will we make it?
Map over the Amundsen Sea. Light blue areas are covered by ice shelves. grey areas are land. Araon (the red dot) want to get over to the western front of the Getz ice shelf to deploy moorings (crosses), but the ice is moving towardsland… will we get past the peninsula in time, or will we get stuck in the ice?
Exercise 2
The wind exerts a stress \((\vec{\tau}=\tau_x\vec{i} + \tau_y\vec{j})\) on the sea surface that sets up a current in the water.The size of the stress can be calculated if we know the strength of the wind: \(\vec{\tau}=C_{D}\left|\vec{u}\right|\vec{u}\), where \(\vec{u}=u\vec{i}+v\vec{j}\) is the wind at 10 m height.
a) If it is blowing 10 m/s towards the north and \(C_D=1.6\times10^{-3}\), how large is the stress then? In which direction is it acting?
b) We know that the size of \(C_D\) change when there is ice on the water and scientist have found that \(C_D=10^{-3}\times(1.5+2.233C_i-2.333C_i^2)\) where \(C_i\) is the fraction of the sea surface that is covered by ice (the ice concentration). For what ice concentration is \(C_D\) largest? smallest? How large was the ice concentration in the exercise above?
Exercise 3
During their expedition on FRAM (1893-1896) the Norwegian oceanographer Nansen observed that the ice was drifting to the right of the wind (he was in the Arctic) and he asked his friend Vilhelm Bjerknes to get one of his students to study the problem. It was the Swedish scientist Vagn Valfrid Ekman who ended up explaining that the motion of ice is an effect of friction and the rotation of the Earth. Ekman developed a theory describing how the current that is set up by the wind behaves. The current changes with depth and we can write: \(\vec{u(z)}=u(z)\vec{i} + v(z)\vec{j}\).
The size of \(u(z)\) and \(v(z)\) can be calculated from the following formaulas (which are not as complicated as they look!)
where \(z\) is height (so the depths are negative), \(f=1.46\times10^{-4}sin(latitud)\) is the Coriolis faktorn (caused by the rotation of the Earth) and \(d=\sqrt{\frac{2\nu}{\left|f\right|}}\) is the thickness of the layer that is affected by the wind. We often call this layer the “Ekman layer”. \(\nu=10^{-2}m^2/s\) is the viscosity* – the “thickness” of the water (syrup has a higher viscosity than water**). The theory is well known amongst oceanographers and is referred to as the Ekman spiral.
* The molecular viscosity of water is much lower \(\nu=10^{-6}m^2/s\), but turbulence and eddies make the effective viscosity in the ocean much higher
What is the value of the Coriolis factor in the Amundsen Sea? In Bergen?
How thick is the Ekman layer? An iceberg can be several hundred of meters thick – do you think it is affected by the current set up by the wind?
If the wind is blowing towards west with 15 m/s and there is no ice – how large is then \(\tau_x\) and \(\tau_y\)? (See exercise 2)
In what direction (and with what speed) is the water in the surface (z=0) flowing? At the Ekman depth(z=-d)? At what depth is the current flowing in the opposite direction to the wind?
Try to plot the current! Why do you think we talk about an Ekman spiral?
When we send down our LADCP*** we get current profiles with a resolution of 8m (i.e we get one measurements for the current every 8 m) Do you think we are able to observe the Ekman spiral? Why/why not?
*** the LADCP is an instrument that we send down together with the CTD all the way to the bottom and that measures the current in the water on its way down (and up) so that we get profiles of current in addition to profiles of temperature and salinity.
Illustration to exercise 4. The wind is blowing parallel to the line A-B. In what direction is the Ekman transport? what would have happened if A-B was the coast line?
Exercise 5
If you sum up (integrate) the current set up by the wind in the Ekman layer we get the transport, that is how much water that is moved in what direction due to the wind. We often call that the Ekman transport \(\vec{Q_{Ekman}}=U\vec{i}+V\vec{j}\), where
\(U=\frac{10^{-3}}{f}\tau_y\)
\(V=-\frac{10^{-3}}{f}\tau_x\)
The unit of U and V is \(m^3/m/s\) (or \(m^2/s\)) and they give the amount of water that is flowing by per meter per second. The expression for \(\tau\) is given in exercise 2.
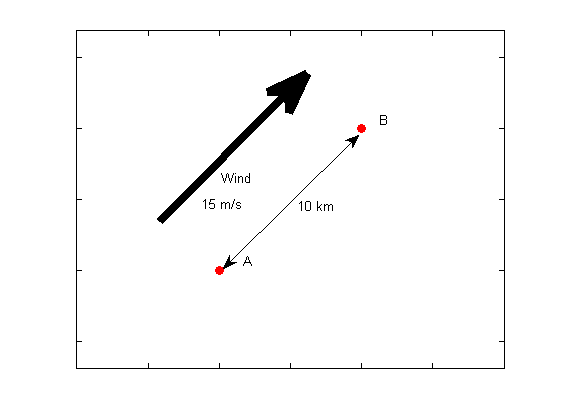
If it is blowing 15 m/s to the northeast and there is no ice, how larger is then U and V? In what direction is the water transported?
How large is the angle between the wind and the transport?
We have two buoys (see figure below) that are place 10 km apart and where a line between the buoys are parallel to the wind. How much water flows between the buoys per second? What do you think would have happened I the line between A and B would have been the coast?
In what direction do you think the water is blowing when the Bryggen in Bergen is flooded (the tides are also important, off cpurse!)
Along the coast of the Antarctic continent the wind is normally blowing towards the west – further north (60S) the wind is blowing to the east. Make a sketch showing the direction of the wind and the Ekman currents. What do you think happens in the middle? Discuss with your friends before reading the answer at the bottom of the page.
Convergence and divergence in the ocean
When the wind and thus the Ekman transport changes direction (or magnitude) from one region to another we get “convergence” or divergence. When we have divergence the surface water in an area “disappears” (i.e. it moves away and is not replenished) and new surface water must be provided from below. The water from depth is sucked up to the surface by the wind. In areas where this happens continuously (e.g. around Antarctica) we find large biological activity, since the water from depth is rich in nutrients. If you want to read more, then google e.g. “Wind driven upwelling”.
The world is turning around and around… all the time! And this has a big influence on where ocean currents go and how winds blow (It doesn’t, however, influence the vortex that appears when you drain your bath tub!). We call this the “Coriolis effect” or “Coriolis force”.
For the experiment, you’ll need:
a cutting board
a long ruler
glue or tape (to glue the ruler to the cutting board)
a pencil
a couple of pens
a white paper
a second pair of hands (someone to help you with the experiment)
Cut out a large* circle from he paper and pin it to the middle of the cutting board with the pencil (check with your parents first that they are ok with that!). Glue or tape the ruler onto the cutting board such that it goes over the paper circle.
Now draw a line along the ruler’s edge while your helper turns the paper circle clockwise. What do you see?
The paper circle represents the world as seen from the South Pole. What would the same thing look like from the North Pole? Turn the paper circle the outer way round to find out!
*but the diameter needs to be smaller than the length of the ruler!
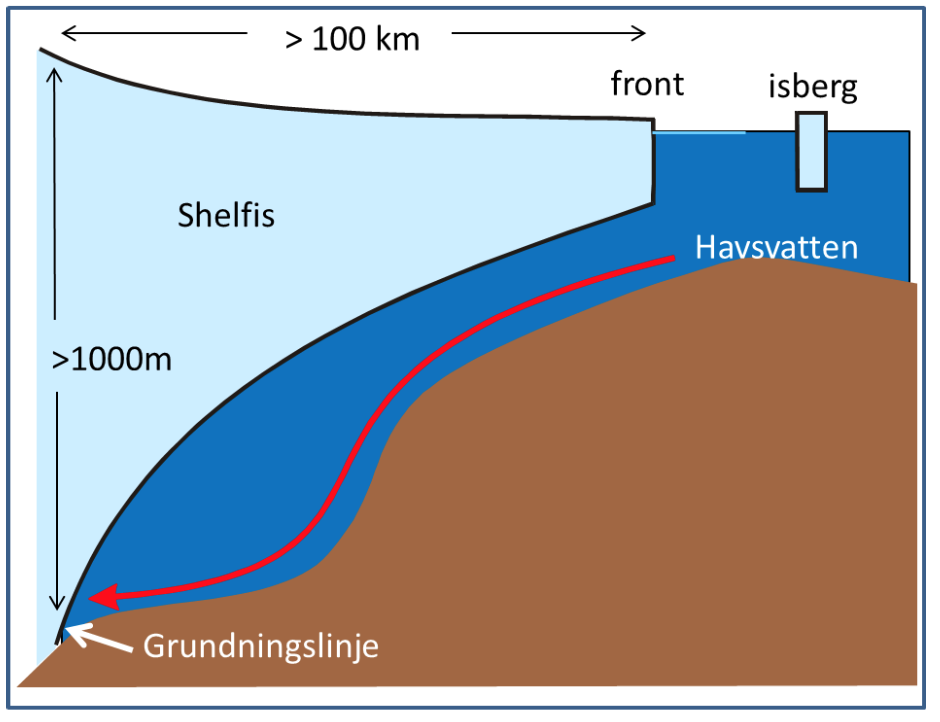
An ice shelf from the side! The red arrow shows warm water entering the ice shelf cavity.
The freezingpoint of seawater sinks with increasing salinity and with increasing pressure – the more sline the water is, or the higher the pressure is, the more you can cool down the water before it freezes. Water from the tap freezes at 0 0\(^\circ\)C and sea water at -1.9\(^\circ\)C. At 1000m depth you can cool down seawater to -2.6\(^\circ\)C before it freezes. Below the large ice shelves around Antarctica seawater gets in contact with ice at large depths. When water is in contact with ice, it will melt ice and cool down to its freezing point. Below the Filchner-Ronne ice shelf in the Weddell Sea the grounding zone (see figure) is located at 1800 m depth. Here the water can become very cold!
Exercise 1
The freezing point is a function of salinity and pressure \(T_f=T_f(S,P)\). For a constant P (i.e. at one depth level) and for small changes in salinity the freezing point is a linear function of salinity and we can write \(T_f=kS+m\).
a) We know that \(T_f(S=34.4,P=0)=-1.8879^\circ C\) and \(T_f(S=34.7,P=0)=-1.9051^\circ C\). Determine the coefficients \(k\) and \(m\).
b) What is \(T_f(S=34.5,P=0)\)?
c) Vad är \(T_f(S=0,P=0)\)? Is this right? Why/why not??
In a similar manner, we have that (for a given salinity) \(T_f=kP+m\).
d) We know that \(T_f(S=34.5,P=0)=-1.8936^\circ C\) and \(T_f(S=34.5,P=1000dbar)=-2.6466^\circ C\). The pressure increase by about 1 dbar per meter, so the pressure is about 100 dbar at 100 m depth, 200 dbar at 200 m depth and son on. Determine the constants \(k\) och \(m\).
e) What is the freezing point at 2000 m depth?
f) My collegue Svein Østerhus have been drilling through the thick ice on the Filchner-Ronne ice shelf and made observations of the water in the cavity beneath the ice. The lowest temperature they observed was -2.53\(^\circ\)C, the salinity was 34.5. What is the smallest depth the observations can be from?
h) What temperatures could you expect to observe at the grounding line (1800m)
Exercise 2
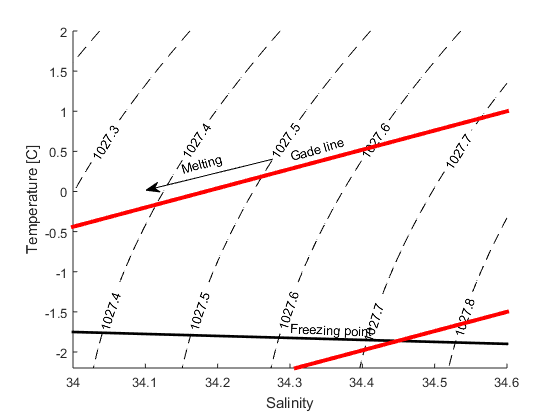
When ice melts in salt water two things happen: the temperature sinks, since the heat from the water is used to melt the ice, and the salinity decreases, since the seawater is mixed with the fresh melt water. To melt a certain quantity of ice we need a certain quantity of heat, if we were to melt twice as much ice, we’d need twice as much heat. The change in temperature is proportional with the change in salinity \(k=\Delta T/\Delta S\)=2.4. A line with a slope of 2.4 in a TS-diagram (a diagram with salinity on the x-axis and temperature on the y-axis) shows how the the salinity and temperature changes when ice is melting in seawater. It is called a “Gade line” (see figure below) after professor H. Gade at UiB.
TS-diagram showing two Gade lines (red lines) and the freezing point (black line). In the exercises we will determine the equations of the lines to find were they cross each other. The dashed lines are isopycnals. Iso means equal, pykno means density – so all water masses (points) on the line has the same density). The number gives the density in kg/m[latex]^3[/latex].a) Find the equation (\(T=kS+m\)) that describes how the temeprature and salinity changes when ice is melting in water with T=2\(^\circ\)C and S=34.6? Plot the line in a TS-diagram.
b) How salty is the water when T=0\(^\circ\)C?
c) How saline is the water when it is at its freezingpoint? Here you’ll need to use the expressin for the freezingpoint that you found in exercise 1 (P=0)
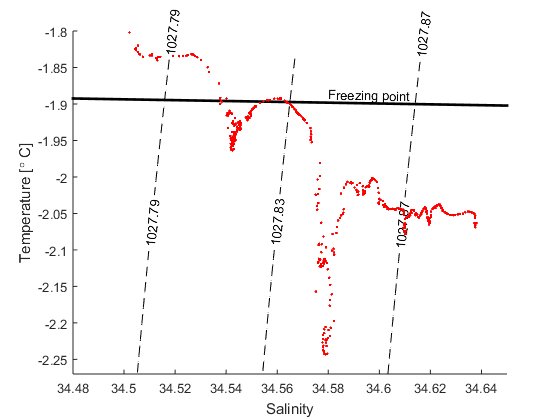
d) The figure below shows a TS-diagram with data from a CTD station (ENG_Filchner_CTD) that was occupied at the front of the Filchner ice shelf when I was there a few years ago. What was the lowest temperature we observed? How saline was that water?
TS-diagram showing data from a station at the front of the Filchner ice shelf. The black point show the freezing point (P=0).
e) Find the expression for the Gade line that goes through the T,S point from (d) and plot it together with the data and the line that gives the freezing point (from exercise 1, P=0)
f) Most of the water entering the Filchner cavity is at its surface (P=0) freezing point. How saline was the coldest water thtat we observed when it entered the cavity, that is, before it melted ice?
Using the Gade line we can determine how saline the water that exit the cavity was when it entered the cavity. Since we know how the salinity changes along the front of the ice shelf (it increases the further west you go) we can also determine where the water entered the cavity
Add water and ice cubes to the bowl and then add the thermometer. Stir a bit. What does the thermometer show?
Now add a little salt and stir well to solve the salt in the ice water. What happens to the temperature? What happens if you add even more salt? How cold can you get your water?
When a mixture of water and ice is in equilibrium, the temperature is at freezing point. When you add more salt, that lowers the freezing temperature (the more salt, the lower the freezing point) and the mixture is no longer in equilibrium.
Heat from the water is used to melt, and the temperature of the mixture sinks, either until all ice as melted, or until the temperature of the water is the freezing temperature.
This week you’ll get a letter from my colleague Svein Osterhus who is onboard another research ship on the other side of the continent… but I thought I’d send you a short update from the Amundsen Sea and a new problem for you to solve!
Foto: Povl Abrahamsen
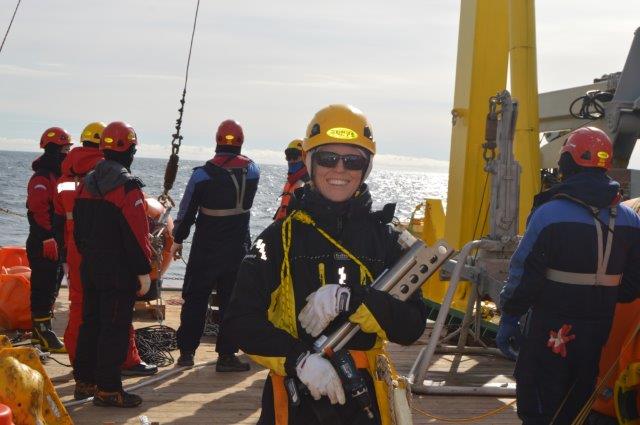
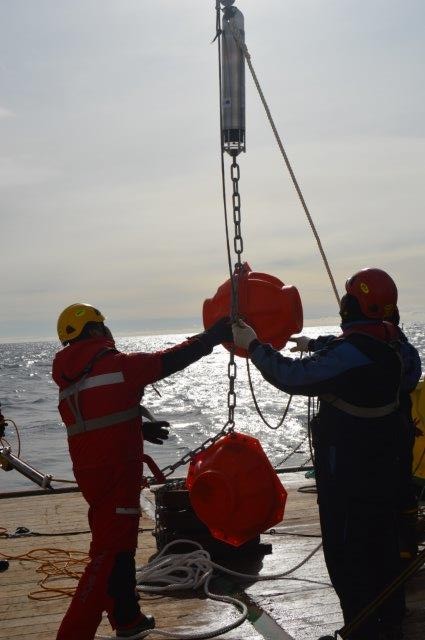
All of my moorings are now in the water – and the nervous butterflies that have flown around in my belly the last couple of weeks are finally gone! There are so many things to prepare, so many things to think about when putting the moorings together – so many things that can go wrong. When I’ve deployed moorings before I’ve always had a technician with me, a technician who has full control over what screw goes where and where those shackles and rings are supposed to be… but this time it was me who was out on deck with a spanner in my hand trying to get everything ready in time. Finally Araon got into position and we could start!
Mr Ham, the Korean mooring technician, gave sign to the winch driver and he elegantly lifts my first orange buoy into the water. Araon is slowly advancing as we feed the mooring line out behind us. Every fifty meter or so mr Ham stops, and Karen and I attach an instrument to the line. Everything goes quick and smoothly – we all know what to do. The buoy gets smaller and smaller in the distance, and soon there is 375 m of mooring line out in the water. Only the anchor (3 old railway wheels) is left on deck, and finally it too disappears into the water with a splash. The orange buoys are pulled through the water as the anchors sinks, but eventually gravity wins and they too are gone. The anchors sinks down and lands on the bottom, normally somewhere between the location it was released and the place where the buoys are last seen. To find out exactly where the mooring is, we use the acoustic release to “triangulate”. At three positions we send down signals to the acoustic release, and based on the time it takes from the signal to come back we can calculate the distance between the hydrophone that we lower into the water to talk to the acoustic releaser and the releaser itself. Since we know where the boat is, we can determine where the releaser (and thus the mooring) is located… maybe you’d want to help out?
When the anchor to the first of my moorings were released we moved 443 m towards -40.2 degrees (see explanation of the directions in the end) and the first triangulation point. The distance to the releaser was then 802 m. Thereafter we moved 862 m towards 172 degrees and got a distance of 754 m. At the last point, the distance to the releaser was 754 m. Then we’d moved 867 m in towards 53 degrees from point number two. The depth is 600 m and the releaser is locate 25 m above the anchor. The hydrophone was lowered 10 m into the water.
Where is the anchor? How far had the anchor drifted? How exact is the triangulation? Can you estimate the error?
The deck unit talking to the acoustic release assumes a sound speed of 1497 m/s when calculating the distances. Using data from our CTD cast we calculated the true sound speed (which is a function of salinity, temperature and pressure) and found the mean speed of sound to be 1447 m/s. Does that matter for the calculations above? Can you correct for it?
The directions are given as degrees counterclockwise from the x-axis. The X-axis is pointing eastward, so if we go towards the east, the direction is 0 degrees, if we go north, it is 90 degrees and if we go south, it is -90 degrees.
With a CTD and LADCP (current meters mounted on the CTD) we can understand where the water is flowing and what its temperature is right now that we are here – but we will also be able to see what happens when we are back home already. We deploy the instruments on so-called “moorings” that stay in the ocean and measure while we are gone, and that we will come and pick up next year or the year after. I have never been in the Amundsen Sea before, so I don’t have moorings to recover right now, only new ones to deploy. But my Swedish, English and Korean colleagues do have moorings in the water – and we are getting more and more excited as we are coming closer to the position where those moorings were deployed two years ago! Karen holds a hydrophone over the railing and down into the water. Then she keys in the releaser’s special code. Far away, deep beneath us on the sea floor, the mooring waits to hear from us – and finally, now, after two years in the ocean, it can reply “here I am!”. Karen types in a second code which means “let go!”, and right away she gets the reply from the mooring: “I’ve let go, I am on my way up!”. All of us are excitedly watching the sea – keen to be the first person to spot the yellow buoy.
– There it is! There it is!
The crew has deployed a small boat to go and fetch the mooring – they know exactly what to do, they have done it many times before.
A couple of hours later all instruments are on board and we are working hard. All data needs to be downloaded to our computers and stored to hard drives. Later, the instruments are turned over and get new batteries and software. Tomorrow they are going back into the sea!
The Koreans weren’t lucky this time round; their first mooring had broken off a bit above the sea floor and therefore they could only recover the releaser and a couple of thermometers. Their other mooring was completely gone – it was probably dragged away by a large iceberg. But the last three came up exactly as planned!
Photo: Nicole Waite
Yesterday we had a meeting with the crew and technicians to talk through what my mooring looks like and to decide how to best deploy it. The crew speaks little or no English*, therefore the meeting was held in Korean – only every now and then I was asked something in English. For almost an hour it sounded pretty much like this:
I took my time and carefully prepared my instruments and tools – trusting that it would be several days before my moorings should go out into the water. The Koreans had four moorings that should go out first. But it got really windy and the waves got higher and higher – and the captain gave the order to stop working on deck because it was too dangerous… And this messed up the whole work schedule! We steamed westward at full speed, to the western part of Getz ice shelf. There is more ice there, and hopefully less waves, so we can use the time while the weather is bad to steam there instead of just waiting around for the weather to get better until we can deploy our moorings. So now it is all of a sudden my last mooring that shall go out right now… and therefore, I unfortunately don’t have time to write more right now!
*I asked La, one of the oceanographers who speaks excellent English, how he learned the language. All the others who speak English well did their PhDs or studies aboard – but I knew La hadn’t done that. After a while I found out that during his studies, he once a week talked in English with those people in Korea who want to talk to you in English for free: Jehova’s witness and Mormons! “But I am still a Buddhist, I just wanted to learn English and couldn’t afford a private teacher…”
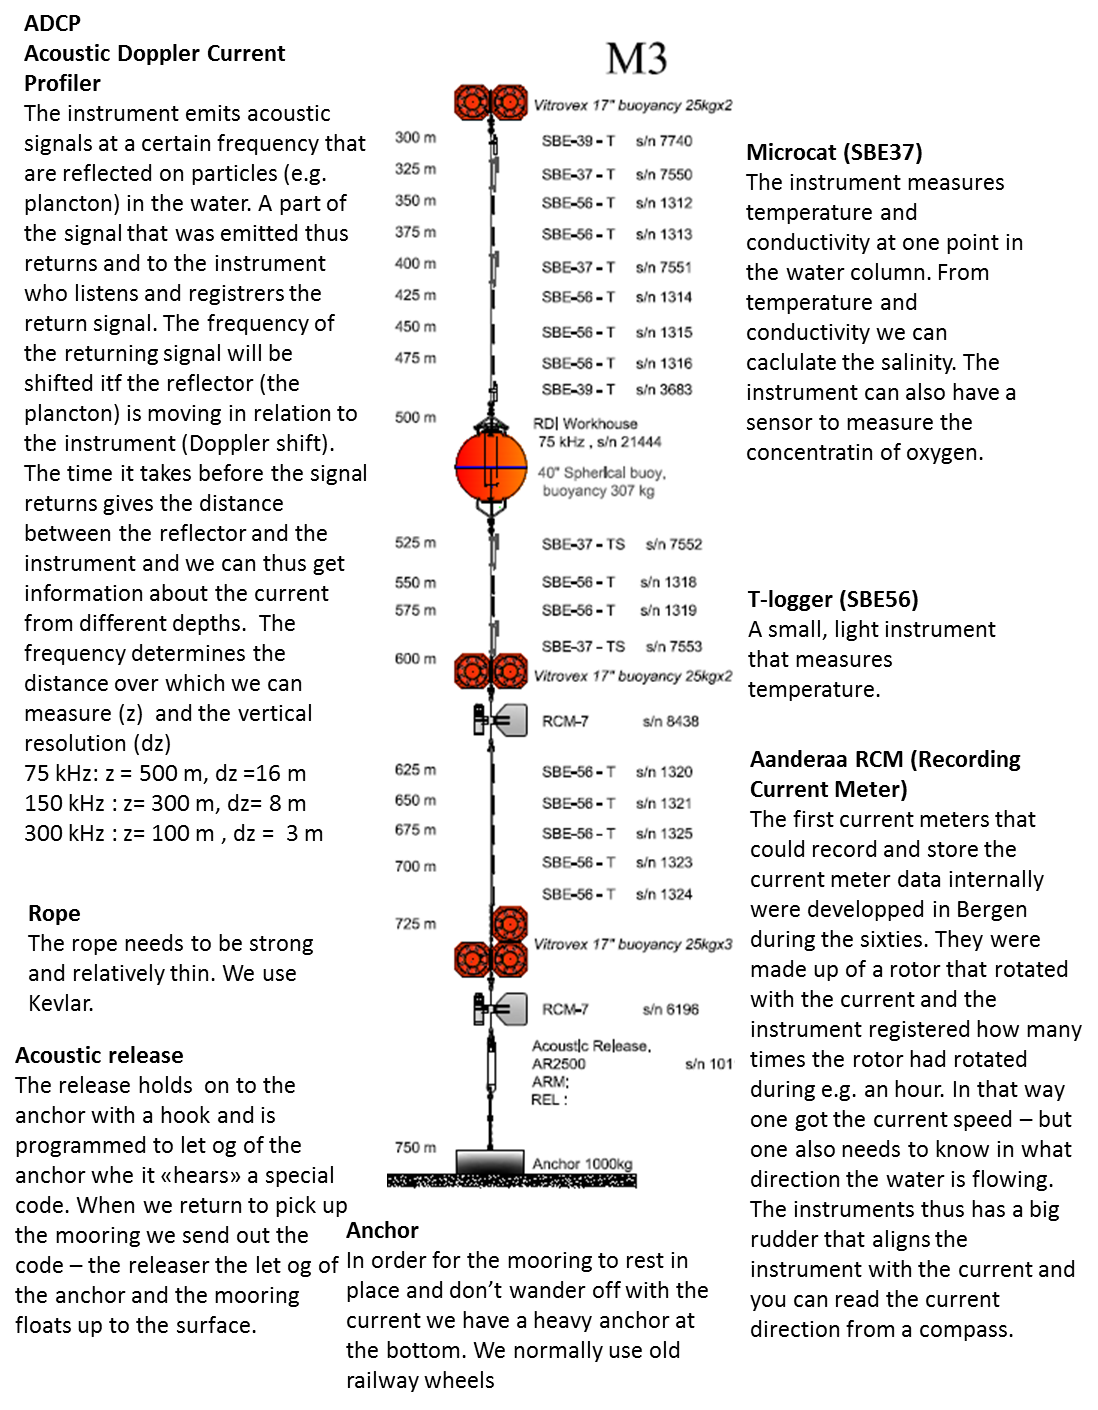
We go on scientific expeditions to the Amundsen Sea every other year or so, and then we do a lot of measurements and learn what things are like right then, when we are there. But we’d off course want to know also what happens when we are not around. To do so we deploy “moorings”. A mooring is and anchor, a line on which we attach instruments and floating elements to keep it upright in the water. The moorings are standing on the bottom and measures (normally currents, salinity and temperature but I’ll also have sensors to measure the concentration of oxygen) until we return a year or two later. What the mooring looks like and what instrument we put on it will depend on what we want to measure. At the bottom of the page there is a drawing of one of my moorings!
Exercise 1
Now you can design you mooring! What would it look like if you’d want to:
a) Study the evolution (salinity and temperature) of the surface layer (let’s say the upper 200 m) over a year in a area where the water is 500 m deep?
b) Study a bottom current that extends 300 m above the bottom
c) Find out how much warm water is entering the cavity below an ice shelf. The depth is 800 m and the draft of the ice shelf is 300 m deep (which means that ice bergs can reach just as deep!!)
Exercise 2
Do the following calculations for you mooring from above or for a mooring which has
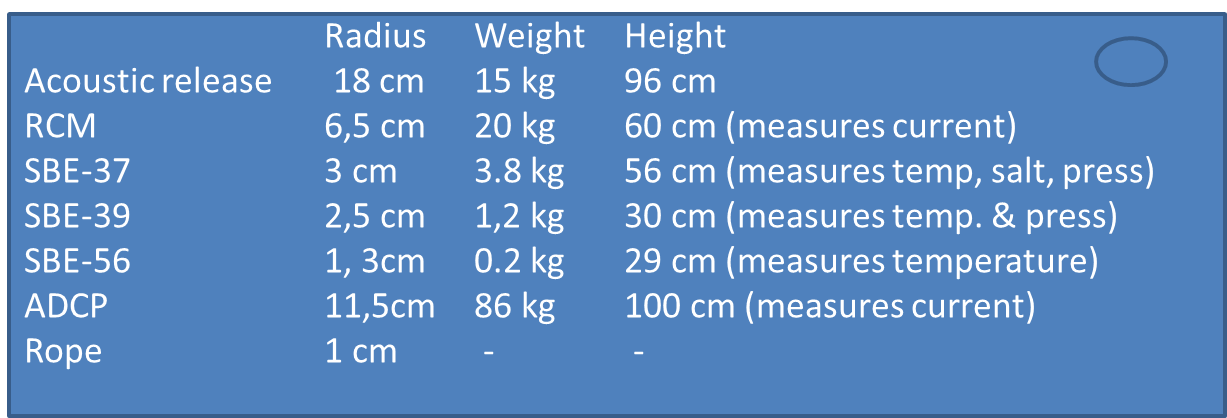
1 x acoustic release (25 mab); 3 X SBE37 (25, 150 and 300 mab), 1 x RCM (50 mab) 1 x ADCP (300 mab) and 5 x SBE56 (50, 75, 100, 200, 250 mab). Mab = meters above bottom.
The instrument has the following dimensions (they are all roughly equal to cylinders)
a) What is the weight of all the instruments in air? In water?
The mooring also needs floating elements to stand up in the water.
b) How much can one glass sphere lift? Their diameter is 43 cm and the weigh 22 kg in air.
c) How many spheres do we need to keep the mooring up right?
Exercise 3
When the current is strong it will tend to pull the mooring down towards the bottom – that is not good. Firstly, you don’t get measurements from the depth you wanted and secondly, many of the instrument cannot measure when they tilt too much, An ADCP, for example, cannot measure correctly if the tilt is above 15 \(^\circ\). So we need to add extra floating elements to make sure that the mooring is not pulled down if the current is strong. The force from the water pulling the mooring down is proportional to the area that the water hits (i.e. the cross sectional area of the mooring).
a) What percentage of the mooring cross sectional area is made up by the rope?
b) By how much is the area reduced if we change for a line that is 6 mm in diameter?
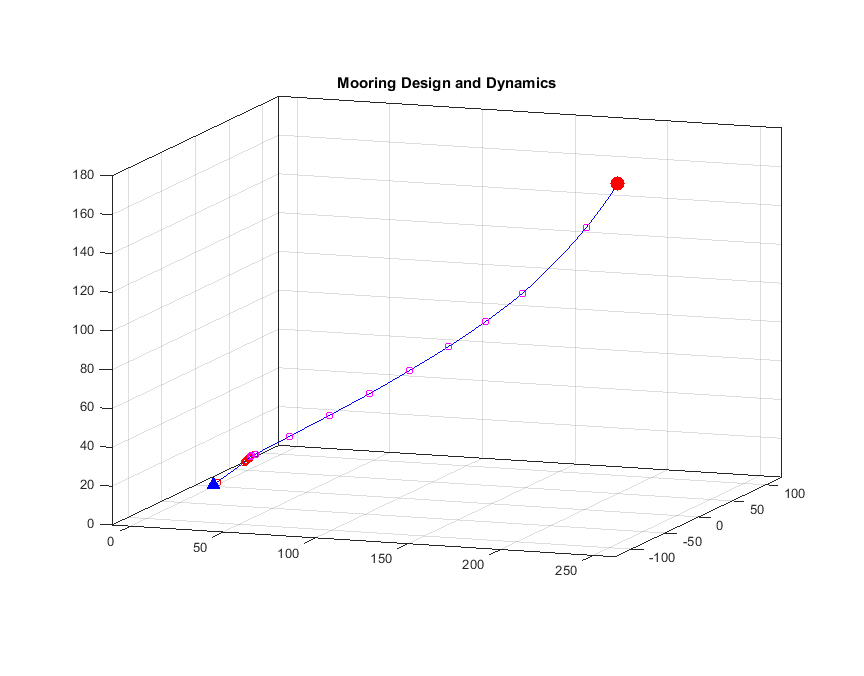
c) An instrument was pulled down to 170 mab and 218 m downstream, another instrument was pulled down to 65 mab and 105 m downstream. The shape of the line can be decribed by (half) a parable. Find the expression for the parable!
d) The pressure sensor on the ADCP shows that it now is 40 mab. How much is it tilting? Can we use the measurements?
e) How high up must it be (at least) for the measurements to be good?
f) Why do you think we prefer to have the ADCP high up looking down, rather than deep down looking up?
One of my moorings during an event with strong current. we use a special program to calculate how the moorings will perform in a current. The program will also tell us how heavy the anchor needs to be!
Exercise 4
When we retrieve the mooring and download the data from the instruments we get time series of current, temperature and salinity. We will now do some calciulations based on data from a mooring that was deployed in the Amundsen Sea in 2012.
a) Import and plot the current measurements from mooring S4, 17-24 June 2012 (ENG_Riggdata_S4_1). Describe what you see!
b) What is the mean current? In what direction was the water flowing? (\(u\) is the current in the \(x\)-direction (towards the east) and \(v\) is the current in the \(y\)-direction (towards the north))
c) If you were to describe the observations with a mathematical function, which one would you chose?
d) Determine the coefficient of your function!
e) An iceberg is floating with the current in the vicinity of S4. Set up an expression for it movement (using vectors) and plot its trajectory. How would you describe its movement?
f) Plot the current a week forward in time using your function from (d).
g) Import the data from S4 24/6-1/7 and plot it in the same figure. Is your model doing a good job predicting the currents? Why? Why not? (The file is named ENG_Riggdata_S4_2)
Exercise 5
Import and plot the measurements of pressure from mooring C2. The file is named ENG_Riggdata_C2. In this location the currents were much stronger than we expected and we had put on too little flotation 🙁
a) How would you interpret the record? (hint – look at exercise 2 above)
b) At what depth is the instrument located when the current is weak? (1 m \(\approx\) 1 dbar)
c) How deep is it pulled down?
d) What percentage of time is it pulled down more than 40 m? 80 m?
e) \(u\) gives the current in the \(x\)-direction (towards the east) and \(v\) gives the current in the \(y\)-direction (towards the north). Set up an expression for the current strength the calculate and plot it! How strong is the strongest current? The mean current? How many km/h is that?
f) Is there a relation between current strength and pressure (that is, the instrument pull- down?) Describe the relation mathematically and with words.
Exercise 6
The instruments are powered by batteries, and every time we make measurements we use a small amount – or a lot if it is an ADCP – energy. We want the instruments to keep measuring until we get back to pick them up – so we have to calculate beforehand how often we can make measurements without emptying the battery. But we also have to think about e.g. tides when determining how often to sample.
a) One of the components of the daily tides has a period of 25.8 h. The tidal current can be described by a sinus curve. The amplitude (and the phase) depends on where we are, but let’s assume the amplitude is 10 cm/s and the phase is 0. Set up an expression for the tidal current and plot it for 30 days.
b) If we made measurements only once a day, what would or time series look like?
c) What is the period of the “oscillation” that we would then observe?
d) The tidal current tha we observe is the sum of many components with different periods, amplitudes and phases. Another component has a period of 23.93h. Set up an expression for that tidal component if the amplitude is 9 cm/s. (You can set the phase to 0) and plot the sum of the two components. What do you see? How is the amplitude changing? How far is it between to “amplitude maximum”? Can you explain what you see? (hint: plot the components as well as the sum of them). Compare the results with the results from exercise 3!
Everybody knows that once upon a time, Archimedes sat in his bath tub and all of a sudden shouted “Eureka!”. But do you know why he did that?
For this experiment you’ll need:
A large glass / jar / jug (which has to be see-through)
A small plastic mug (which fits inside your glass / jar / jug)
A couple of coins, small pebbles or something else “heavy”
An apple (or something else that floats)
A non-permanent pen
Fill the large glass with water and mark the water level on the outside of the glass. Then put the little plastic mug inside. Fill as many coins (or other “heavy” things) into the small plastic mug until it sinks. As you are filling coins into the small plastic mug, the water lever rises. Mark how high the water level is right when there are so many coins inside the plastic mug that it sinks!
Now take all the stuff out of the large glass again. The water level goes back to where it was before.
What do you think would happen if we added all the coins to the large glass directly, without putting them inside the floating plastic cup? Do you think the water level would change? And if it changed, where would it end up relative to the two marks you already made on the glass?
Now try and check whether you guessed correctly!
Then do the experiment again, this time with the apple. What happens?
