In the highlighted paper we present the latest data from the southern Weddell Sea (including temperature time-series from one of my LoTUS-buoys that I tell about here), which reveal that 2017 was a special year. The seasonal inflow of warm water that we typically observe to flood the continental shelf during summer was warmer and longer than normal, and we suggest that the anomalous conditions are linked to a fresh anomaly developing upstream as a consequence of high summer sea ice melt. The presented mooring records end early 2018 – showing that the shelf density then was lower than normal, potentially leaving the “door open” for an earlier than normal onset of next year’s inflow.
Hopefully Polarstern (and I!) make it back to the Weddell Sea this winter (despite Corona) to recover the moorings deployed in 2018, so that we can tell the rest of the story and learn more about the implications of freshwater anomalies.
They tend to be long and deep, they have one or many sills, they are breathtakingly beautiful and they were carved by ice a long time ago*… I’m off course thinking about the Norwegian fjords! My teaching has brought me back into fjord oceanography (I wrote my Master’s about water mass transformation in a fjord on Svalbard), and last summer I had a little hobby-project trying to figure out how climate change would affect the renewal of the deep water in a fjord… and now that hobby-project is about to get published in “Estuarine, Coastal and Shelf Science”!
But let’s start from the beginning! Like I wrote in the first line, a fjord has a sill. The sill closes off the deeper part of the fjord basing from the rest of the ocean, and so water in the deep basin is stagnant, i.e. it is cut off from the rest of the ocean.
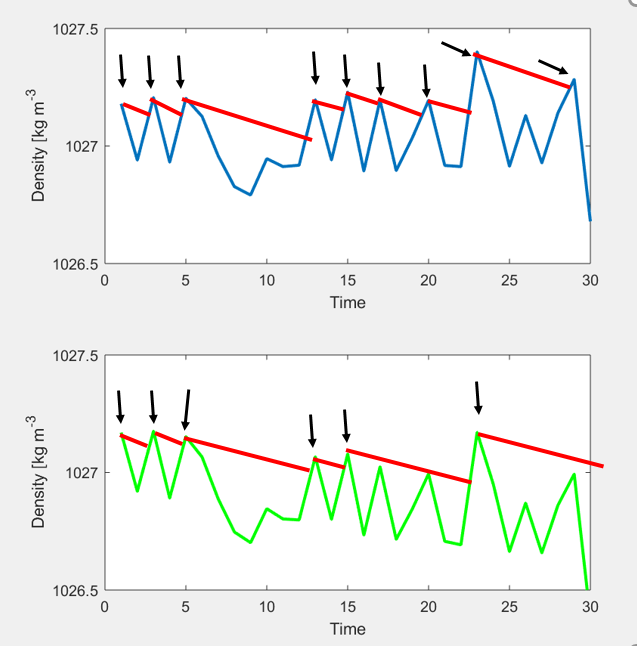
With time, the density of the basin water will decrease (as turbulence causes lighter water from above to be mixed down). The density of the water outside of the sill (at sill level) varies in time – e.g. because of wind blowing along the coast that pushes the dense water down or lifts it up– and at some point the water outside will be dense enough to flow into the fjord and replace the basin water and the basin water is “re-newed”. How often the deep water is renewed varies greatly between fjord systems – in some fjords the deep water would be stagnant only a couple of weeks while it may be many years between two renewals in others. How long the water stays in the fjord depends mainly on two things: how quickly the density in the fjord decreases (the slope of the red line below) and how variable the density of the coastal waters are (the wiggliness of the blue line). If the density decreases fast, the interval between to renewals will be short, and if the ambient density is very variable, the interval will be longer (on average). If we have information about the density decrease and the density variability for a particular fjord, then we can estimate how long it will be between two renewals (on average) and say something about the probability for very long stagnation period.
Does that matter? Well, fish and other creatures that lives in the fjord consume the oxygen in the water, and the longer the water stays in the fjord the lower the oxygen concentration gets and the tougher it gets for the animals who live there to breathe. So yes, it matters, so fish (and others that care about the environment in the fjord) would want to know if the likelihood of deep water renewal is changing.
The Institute of Marine Research in Norway have hydrographical stations along the coast, that have been collecting salt and temperature data (from which one can calculate density) every other week (roughly) since the 1930s. The data show that the density typically is highest during spring and summer – and that after around 1990 the densest water is becoming less dense (on six out of eight stations). Superimposed on the ambient density variability, we have a negative trend (green line above). The trend is bad news to, for example, the fish living in the fjord basins, since the decreasing trend will increase the length of the stagnation period (fewer black arrows). In Masfjorden, for example, the statistical framework that I develop in my paper suggest that the fish would have to wait (on average) two years longer for new, oxygen rich water and that the risk of stagnation periods longer than 10 years increase by a factor of six.
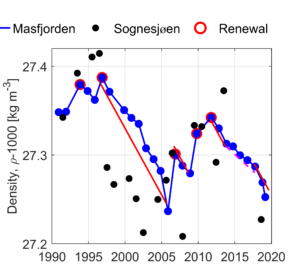
The last deep water renewal** in Masfjorden probably occurred around 2011 (see below), and data from a cruise in June this year show that there has been no renewal so far this year and that oxygen concentrations now are around 2.3 mL/L. Unfortunately, my model cannot predict if there will be a renewal this year, only say something about the probability that the deep water will be renewed.
Density at the bottom of Masfjorden (blue). When the deep water is renewed, the density increase (marked with red circles). From Darelius (2020), Estuarine, Coastal and Shelf Science (Creative common license CC BY 4.0)
* or possibly designed by Slartibartfast?
** There has been partial renewals after 2011, where the upper part of the fjord basin is renewed.
Corona is turning our lives up side down – but that’s no reason not to stand up and sing “Happy Birthday” to Prof. Emiritus Arne Foldvik who turns 90 years old today! (Those of you who read Norwegian can read about him here)
Arne started out his scientific carrier as a meteorologist, studying among other things the waves that are generated when wind blows over topography (he did that using the long tank down in the basement of GFI where I’ve taken my students to play with Nansen’s dead water) – but he later turned to oceanography. Around the time when I was born he led his first Norwegian oceanographic expedition to Antarctica and the southern Weddell Sea. During that expedition he found what the Americans had failed to find a few years later: The Filchner overflow, an enormous* under water river that carries cold and dense water from the Filchner-Ronne ice shelf cavity to the bottom of the Weddell Sea. This discovery is one of the reasons I’m working with polar oceanography today, as I spent the three years of my PhD revisiting the exciting data that Arne & co had collected in the outflow.
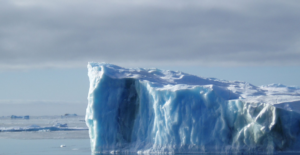
The last time Arne came by my office, we chatted about towed icebergs, melting ice and the experiment I did in my “Nansen’s memorial lecture” (which Arne attended). Arne has been involved in projects where the aim has been to tow icebergs from Antarctica to dry areas in demand of freshwater (originally the middle east, and just a few years ago, to South Africa ). Arne told me, that if one did that, one would get ice into water warm enough, that the results of my experiments would no longer hold.
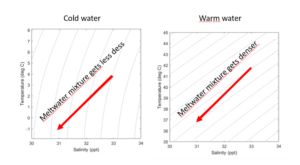
The density of seawater is a non-linear function of temperature and salinity, and while salinity dictates the density for cold water (causing the lines of constant density to be almost vertical in the TS-diagram below), temperature is more important for warm water (causing the lines of constant density to tilt more). So, that means that while the (fresher and colder) melt water mixture is lighter than the ambient water if it is cold, it will actually be denser if the ambient water is warm enough! Off course we had to try this out – I never got around to doing so, but yesterday, Mirjam finally did!
Somewhat disappointing – we realized that the result is more or less the same, independent of the water temperature. Does that mean the physics (and Arne) are wrong??? Probably not, it probably just means that the molecular diffusion of heat is acting fast enough that the “cold” melt water mixture doesn’t stay cold enough to sink 🙁
Anyway, here’s a stratified toast to Arne Foldvik! HAPPY BIRTHDAY!
Temperature-Salinty diagram for cold and warm water. The dashed lines are lines of constant density (increasing density to the right) and the red line is a “Gade line”, which shows how temperature and salinity decrease as ice melts in seawater.
* 1.6 million cubic meters per second – that is almost ten times the Amazon river
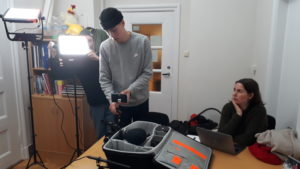
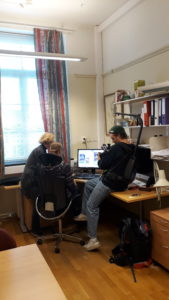
A while ago I was asked by the university (#realfaguib) if I wanted to present myself and my work in a short movie that they want to show to future students – and a few days later I found my office occupied by cameras of different sizes and three very nice journalists/moviemakers/photographers that came along. I quickly realized that making a short movie – I think they only want a minute or two – takes a loong time! Repeat, repeat, repeat – look into the camera, walk faster, walk slower, one more time, slower, shorter, clearer, louder, start over, look that way, look here, smile, don’t smile… at the end of the day, I was quite happy that I’m not a Hollywood movie star but an oceanographer in Bergen
Camera – and light – invasion of my office!Kjersti and me doing our best to ignore the camera…
I remember vivid discussions with Anna over a loaf of freshly baked bread from our new bread machine. We were in the Southern ocean, somewhere in between New Zealand and the Getz Ice shelf in the Amundsen Sea on board the Korean icebreaker Araon and we talked about the moorings we were about to deploy, the proposal we have started writing, the experiments we wanted to run – but most of all we talked about what actually happens when ocean currents meet an ice shelf front. That was four years ago – and I’m super excited to see that a few days the results of those discussions (and a good deal of work on board Araon, on and around the rotating Coriolis platform in Grenoble and in numerous offices around the world) were published in Nature! Ice front blocking of ocean hear transport to an Antarctic ice shelf by A. Wåhlin, N. Steiger, E. Darelius, K. M. Assmann, M. S. Glessmer, H. K. Ha, L. Herraiz-Borreguero, C. Heuze, A. Jenkins, T.W. Kim, A. K. Mazur, J. Sommeria and S. Viboud – in Nature! (For those of you who are not into peer reviewed litterature and scientific publishing – this is probably scientific equivalent to an Olympic gold medal!)
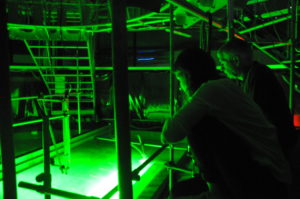
So what did we find out – well, to make a long story short – we oceanographers talk about two types of currents. They are both driven by pressure gradients – but for what we call barotropic currents, the pressure gradient is caused by differences in sea level (i.e. in how much water there is) while for baroclinic currents, the pressure gradient is caused by differences in density (i.e. how heavy the water is). The barotropic current is depth independent – this means that the current is equally strong from the surface down to the bottom, while the baroclinic current changes in strength (and potentially in direction) with depth. Our observations showed that the currents bringing heat towards the Getz ice shelf had both a barotropic and a baroclininc (bottom intensified) part. The barotropic part was the stronger one and the one carrying the majority of the heat. But when the current reached the ice shelf front (Anna was brave enough to deploy a mooring only 700m from the ice shelf front) – the strong barotropic current had to turn, and only the weaker baroclinic current was able to enter the ice shelf cavity. The experiments at the rotating table showed the same thing – barotropic currents turned at the front, while baroclinic currents could enter.
Experiments at the Coriolis platform in Grenoble – a 13 – m large combination of a swimming pool and a merry-go-round!
You can read more about what we did in the Coriolis lab here, and about when Karen recovered the moorings here
Kjersti, Steffi, Elin and myself (Mirjam) recently discussed ways to better integrate the GEOF105 student cruise into the course. My suggestion was to ask the students to observe things throughout the whole duration of the course, and then have them relate their time series with what they observe when “at sea”. In this mini series tagged #BergenWaveWatching, I write up a couple of suggestions I have for observations that are easy and fun to make. I am anticipating that my suggestions will be strongly biased towards #wavewatching, so if you have any other suggestions, I am all ears! 🙂
Neither wave watching nor particularly Bergen-specific, but still super cool! And probably as close as I will ever come to suggesting any kind of meteorological observation. Clouds are pretty amazing, too, but I really don’t know enough about those…
Where to go
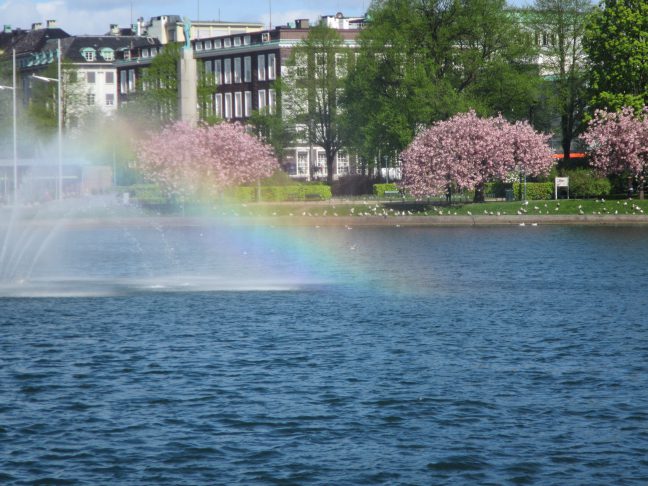
Nowhere specific, just keep an eye out for situations in which there are water droplets in the air and the sun is low enough in the sky for rainbows to appear. Be aware of where rainbows would appear if they were visible (the shadow of your head would be in the center of the rainbow) and check out if they are there.
It doesn’t actually have to rain for rainbows to appear…
When to go
Since the sun needs to be sufficiently low in the sky for rainbows to be above the ground, rainbows are more likely to appear in the morning and afternoon.
What to look out for
Duh. Rainbows?
What to do with the data
I think it could be fun to try and relate the appearance of rainbows to the kind of weather. Obviously, you need both sun and rain. But for double rainbows, you need several rain fronts behind each other. And for a secondary rainbow as in the picture on the very top (blog post on that here), you need strong sunshine.
The observations suggested here are also well suited for a description of the phenomenon and an explanation of the physics behind it.
How this is relevant for the student cruise
Not directly, but I think getting into the habit of observing something fairly specific and, over time, becoming an expert on spotting and explaining rainbows, is pretty awesome!
Do you have suggestions for us? What other spots or topics would you recommend in and around Bergen to be added to the #BergenWaveWatching list? Please leave a comment! We are always looking to expand this list!
Today I’ve been listening in on the COSMUS cruise-planning meeting at AWI in Bremerhafen – it’s been great to hear all the groups that are joining the cruise tell about the exciting research that they are planning! During 75 days – no that’s not a typo, 75 days or almost eleven weeks* – at sea, physical oceanographers, sea-ice physicists, all sorts of biologists and bio-geo-chemists will live and work onboard Polarstern – and people will do so many cool things! There will be bottom landers that measures the oxygen consumption of benthic fauna, bottom crawlers that map the ocean floor at millimeter precision, microplastic filtering, profiling with high cameras to quantify the amount of sinking organic matter… and off course plenty of good old CTDs and moorings! There will also be seal tagging, and I was excited to see my name in the group of people that gets to go on the ice and actually meet the beasts up close!
I joined Polarstern on a cruise in 2005, when I’d just started on my PhD. I bet many things will have changed – but rumours has it that “Zillertal” (the small bar) is still around!
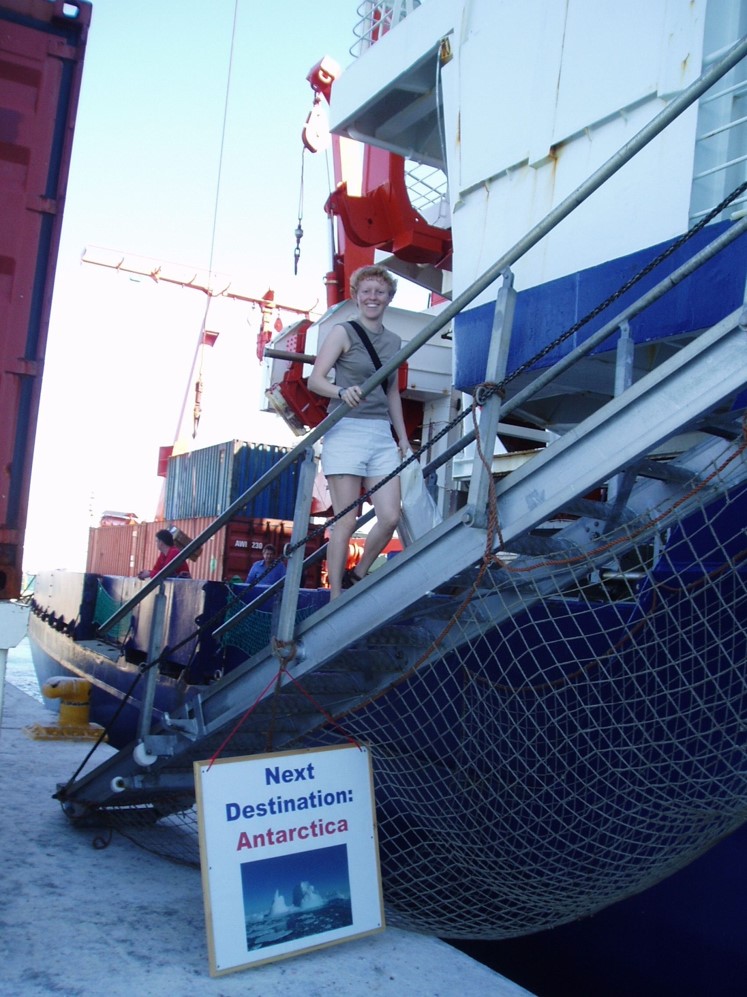
Joining Polarstern in Cape Town for my first Antarctic cruise in 2004. In 2021 I’ll do it once again.
*I didn’t tell my husband yet that the cruise will be that long, not quite sure about how to break the news… I’ve been told to tell things like that when there are lots of people around – and preferably nice food on the table… but I’m not sure about that one!
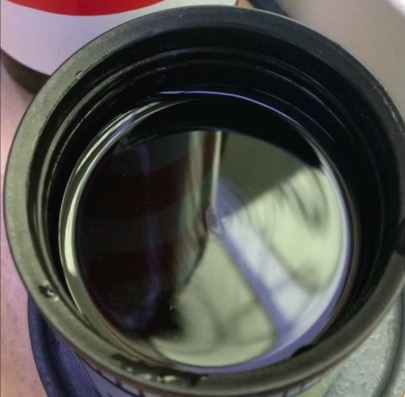
Congratulations to @MarkusMelin4 and @cisprague who has recovered four out of four moorings in the Amundsen Sea! Despite fishing vessel rescue-operations, iceberg-on-top-of-mooring-problems and strong winds the four moorings and all of the instrumentation are now safely on deck! One of the top boys had suffered from an iceberg encounter and the connector plug on my ADCP (A large instrument that measures the current velocity in the water column using acoustics and Doppler theory) had been leaking…. but that’s just little scratches when you consider that they’ve spent two years in the water!
I look forward to see what the records has to tell us about the currents and the hydrography around the Getz ice shelf. Stay tuned!
Uff – seawater can do horrible things to instruments. Luckily it can be repaired! Photo: Markus Melin
Kjersti, Steffi, Elin and myself (Mirjam) recently discussed ways to better integrate the GEOF105 student cruise into the course. My suggestion was to ask the students to observe things throughout the whole duration of the course, and then have them relate their time series with what they observe when “at sea”. In this mini series tagged #BergenWaveWatching, I write up a couple of suggestions I have for observations that are easy and fun to make. I am anticipating that my suggestions will be strongly biased towards #wavewatching, so if you have any other suggestions, I am all ears! 🙂
Where to go
We spotted standing waves in a bucket on the latest GEOF105 student cruise, but in addition to on ships, they can also be spotted for example on trains (see pic below), in cars, or even on washing machines.
What to look out for
The pattern that form on the surface of vibrating fluids
What to do with the data
Describe the pattern and try to understand why it looks the way it does (like I did here). Is it the frequency of vibration? The shape of the vessel? The material of the vessel? The location relative to the source of vibration?
Do you have suggestions for us? What other spots or topics would you recommend in and around Bergen to be added to the #BergenWaveWatching list? Please leave a comment! We are always looking to expand this list!
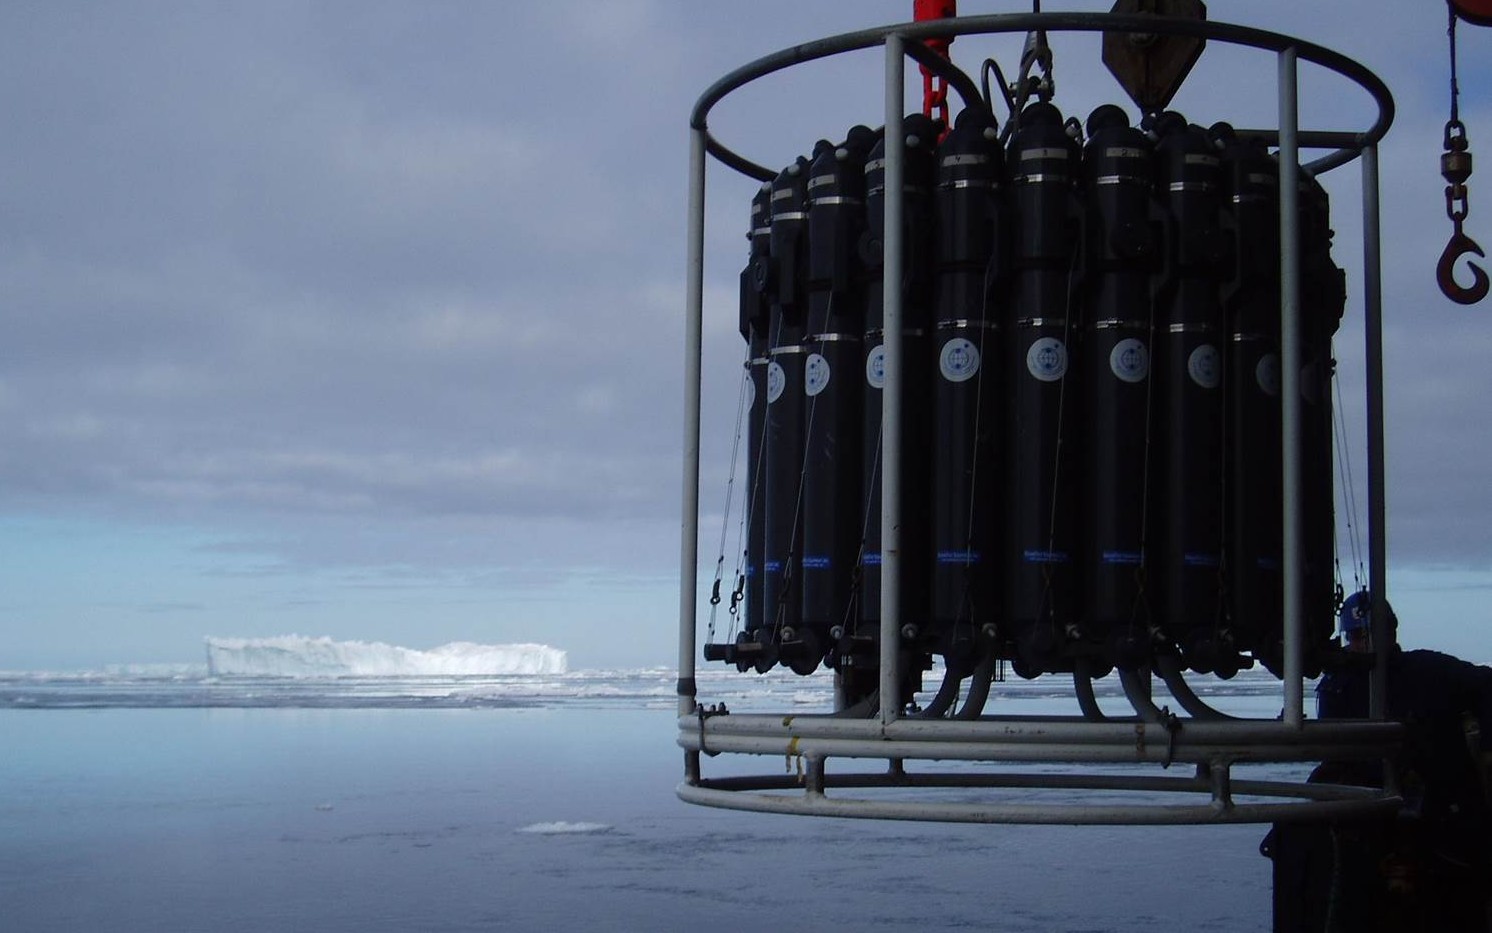
CTD – which is short for Conductivity-Temperature-Depth – is indeed a much appreciated instrument by every (sea-going) oceanographer. You send it down to the bottom of the ocean, and back comes nice profiles of temperature, conductivity (from which one can calculate salinty) – and whatever other sensor you’ve attached (oxygen, chlorophyll, and turbidity for example)
The CTD in its rosette on its way down into cold Antarctic water on a Polarstern cruise.
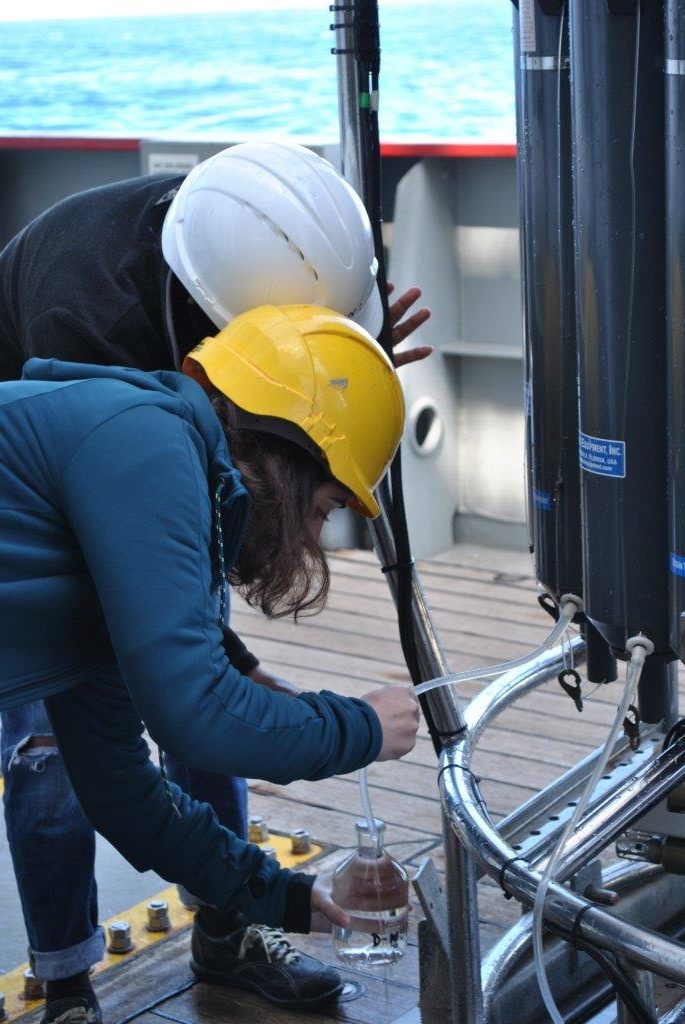
Most of the time the CTD is mounted on a rosette, which carries bottles so that one can also collect water samples from selected depths. But make sure to have the bottles open when you send them down – otherwise they will implode, and that is not a good thing, believe me!
Filling bottles with water at the freezingpoint (-1.9C) is a cold job!