Aaaah… full panic! It is three o’clock on a Friday afternoon. All the cargo that is being sent to me from Sweden to Polarstern is missing some mysterious export declaration number, it is stuck in customs and can’t be loaded it until the right number is on the right document. Sven, an extremely helpful technician at Gothenburg’s University is in contact with a German company that hopefully can help us obtain the missing numbers… all of a sudden I get an e-mail from him saying that they need a detailed description of all the goods and its intended usage – in German. Now. I did two years of German back in high school – and I’ve brushed it off a bit lately with Duolingo since I know I’ll spend most of the winter on a German ship… But I’m not quite at the point where I can describe oceanographic instrumentation on the fly. I start with google translate – while desperately calling everyone I know who speaks German. No Nadine, No Mirjam… but Stefanie finally saves my day and makes sure that the text that google translate has produced isn’t just garbage. The document is on its way through cyberspace to the German company – and I’m back to correcting my student’s lab reports. Luckily, they are not in German!
When asked whether you want to go to Antarctica during regular times, there’s just one sensible response. When asked whether you want to go to Antarctica during highly unusual times, there’s still really only one possible response – you grab the opportunity with both hands, and you go to Antarctica. In a week, I’m starting a slow but steady journey towards Antarctica. I thought I’d write a bit about everything that’s happening now, the plan for the cruise and preparations. But first, since this is my first contribution to the blog, I’ll start by introducing myself.
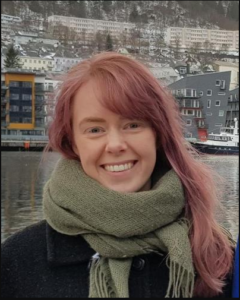
Vår Dundas started working as a PhD-student with Kjersti and I this summer – now she is off to Antarctica. Photo: Private
I’m Vår, and I started my Ph.D. this summer at the Geophysical Institute in Bergen with Elin and Kjersti as my supervisors. Right now, I’m working with mooring data from the Amundsen Sea, but the next step is to begin a combined model and mooring study from the Weddell Sea. There, I’ll be looking mostly at shelf-break interactions at the Filchner trough opening and look for wind-field conditions favorable for far-reaching on-shelf heat transport.
Since I started working with Antarctic oceans, I’ve had a small hope that I would get the chance to join a cruise and go there sometime. So when I one Monday morning in the middle of October opened my inbox to find an email with the header ‘cruise’, stating that there was a possibility that I could travel to Antarctica this winter, I was slightly speechless and very excited. After a week or so with anticipation, I got a confirmation that I would be able to join the cruise. Since then, the practical details have started to dawn on me: In total, we’ll be gone for two months (including Christmas and new years). Of these two months, we will spend about 7 to 10 days in Antarctica. So how does this add up? Due to Covid, we start off by spending one week in isolation at a hotel in Denmark. After this, we board the ship but need to stay in port for a week to finish our two quarantine-weeks. We then start our transect southwards, which takes four weeks. Reaching Antarctica, we do our science for 7 to 10 days (fingers crossed for 10) before a week-long transit takes us to Cape Town, and we fly home. I realize that I dread the first week of isolation, but then again, when you’re able to go to Antarctica, there’s just one sensible response.
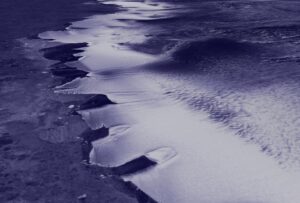
The Norwegian Polar Institute is organizing the scientific work on this cruise. In total, the science team will consist of five people: Tore Hattermann, Kirsten Forssan, Sebastien Moreau, Julius Lauber, and myself. The plan is to make our way to the Fimbull Ice Shelf, where they have moorings that need some updates. These moorings are located along the continental shelf-break, where the ocean depth suddenly drops from a few hundred meters to about 2000 meters. Processes along this shelf-break are crucial for the southward flow of warm water, and consequently, important for how much the ice shelves melt. These moorings are also upstream of known regions where warm water flows in under the Fimbull Ice Shelf, where other moorings are located. A mooring array here can therefore provide valuable information on how upstream conditions affect the Fimbull Ice Shelf.
In addition to the mooring retrivement and deployment, we will run a couple of CTD-sections (conductivity for salt content, temperature, density) and (hopefully) measure turbulence along the ice shelf front and underneath the fast-ice cover. If the weather permits it, we will also go onto the ice and measure properties underneath the ice.
The ship we are traveling with is not a usual scientific ship, but a freight ship, traveling southward to supply the Troll station. This means that it does not have the scientific equipment installed – we have to make a make-shift scientific deck with labs and winches ourselves. If this works out well, it will open up for new possibilities, where scientific data collection and supply missions can be done all at the same time, which is actually quite exciting.
Right now, I’m trying to get my head around everything I have to get done before I leave. It’s challenging to think about learning how to use the MSS-instrument and remember to download all the data I think I might want to work with for the next two months, at the same time as deciding how many woolen socks I need and what I’ll wear for Christmas. Still, I just shipped off one bag to the ship, I’ve gotten my health and teeth certificates signed, so I think I’m getting there. And there’s still one week left before I’m off.
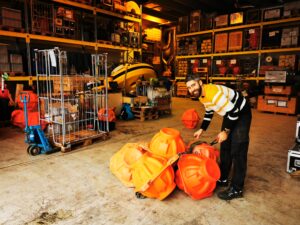
Algot Peterson and bright orange buoys that are to keep my moorings upright in the Weddell Sea. Photo: E. Darelius
My five pallets with equipment for this winters expedition to the Weddell Sea is now finally on their way to Bremerhafen & Polarstern! Many thanks to Helge and Algot for helping me packing and preparing – and to Tor for taking over when they ran away with Ilker to the Barents Sea, leaving me to finish up all the paper work – freight lists and proforma invoices are luckily not part of my standard vocabulary, but during the last couple pf weeks it feels like I’ve been doing nothing but that… and I’ve definitely learnt more about dangerous goods and codes like UN9031* and LQ** than I ever wanted to know! I do appreciate that Helge & Algot are back ashore!
This semester, Kjersti is teaching GEOF105 under very difficult circumstances. While much of the class happens virtually, both the mandatory lab experiments and the student cruise could (luckily!) happen. So we could also do our planned Instagram-takeover of @realfaguib‘s account!
For a week, we used Instagram’s “Story” function — pictures that can be annotated and that vanish after 24 hours (not completely, you can still see a whole week’s worth of posts here if you like) — to give little glimpses of what it is like to do experiments on rotating and non-rotating tanks, and to be on a research ship for the first time.
Instagram Stories turned out a really good tool for that, for example because we could insert gifs to illustrate concepts. Above, for example, the football above the rotating tank is spinning around its own axis, while the one above the non-rotating tank is not in motion.
And of course people like seeing pictures of cruises and colorful instrumentation!
After some initial hesitation, we were lucky enough that Ide and Stephanie took over our take-over and helped make it even more authentic & fun. Thank you!
Watching their story and seeing student cruises through students’ eyes was really interesting!
With between 700 and 1000 views for each image in the story (plus some really good questions related to what we do at sea!), we feel that we had a really successful week in terms of reaching current and prospective students with interesting stories about the issues at heart of GEOF105.
That said, the only thing left to say is a huge “thank you!” to captain and crew (who, after lunch break, swapped roles) of the research ship Hans Brattstrøm, and to @realfaguib for giving us the opportunity!
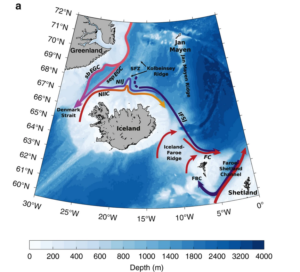
Although the Ocean still holds many secrets, it’s not very often nowadays that oceanographers discover new currents – but earlier this week one could read in NatureCommunications (and on nrk.no, in Norwegian) that scientists have drawn a new arrow on the map showing current systems in the North Sea! The “new” current brings dense water eastward along the Greenland-Scotland ridge from Iceland towards the Faroe Bank Channel, through which the dense water continues southwards into the North Atlantic.
I was very excited (and admittedly a litte bit proud!) to read about the discovery – since the paper is written by Stefanie Semper – the very first Master’s student that I supervised on my own. Stefanie has just submitted her PhD-thesis here at UiB, and I’m certain she will continue her great scientific work and that I’ll have the pleasure to read about her findings in the future!
The name of the current? Well, it’s not officially “Stefanie’s current” (although I’ll think of it as that) , but the slightly more descriptive (although boring) “the Iceland-Faroe Slope Jet”.
The upside of the pandemic is that a lot of interesting meetings and presentations are streamed and recorded so that one can “shop around” and participate & listen without worrying about neither time zones nor CO2 and travel budgets.
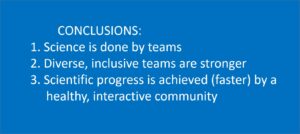
Last night I had the pleasure to listen to Fiamma Straneo’s lecture “Ahoy captain, is that a glacier up ahead? Lessons learnt from working in Greenland’s marine margin” which is part of the International Glaciological Society Global Seminar Series (freely available here). I write “listen”, since the children’s drawers were empty and I had to do laundry at the same time – so I probably missed out on a lot of nice graphics and photos from the Greenlandic fjords that she was talking about… but I did not miss out on her conclusions:
Fiamma Straneo’s conclusions during the her talk in the IGS Global Seminar Series (https://www.youtube.com/watch?v=QpvjxoNWSLc)
Fiamma, who is a physical oceanographer working at Scripps while holding a Prof II position at UiB, and who is very much a team-player herself, used examples from her own research – from multi-disciplinary field campaigns in remote fjord arms to the (equally) multi-disciplinary and diverse team that stands behind the ISMIP6 projections – to support her conclusions, and she did so very convincingly. Science is indeed a team sport!
Yesterday Mari Myksvoll visited me and the oceanography group at GFI and we had a nice chat about fjords, oceanography, and everything in between! We are lucky to get to see Mari more regularly in the hallways from now on, as she soon will be joining us (20%) as an Associate Professor II. The paperwork is not yet in order, but the university administration better hurry up since the plan is that she will be teaching GEOF337, the master’s course in fjord oceanography, next semester. With her background in fjord and coastal modelling – and with her enthusiastic smile – I’m sure she will do a great job! And I will for sure enjoy to have another female*, fjord-interested oceanographer around! Welcome to GFI, Mari!
Mari S. Myksvoll will join us at GFI as Ass. Prof. II next semester!
Our ice shelf work is now available in a “young-mind-version” – have your daughter / son / grand children / children of your neighbours / random kids in the street and everyone else with a young mind check it out here ! And have a look yourself too while you are at it! It’s a lot easier to read than the text in Nature – and the illustrations are really cute!
Many thanks to Mirjam and to the two young reviewers (Margarita and Isabel) for making this happen!
New article in Frontiers for Young Minds about ice shelves and warm ocean currents. from: https://kids.frontiersin.org/article/10.3389/frym.2020.00124
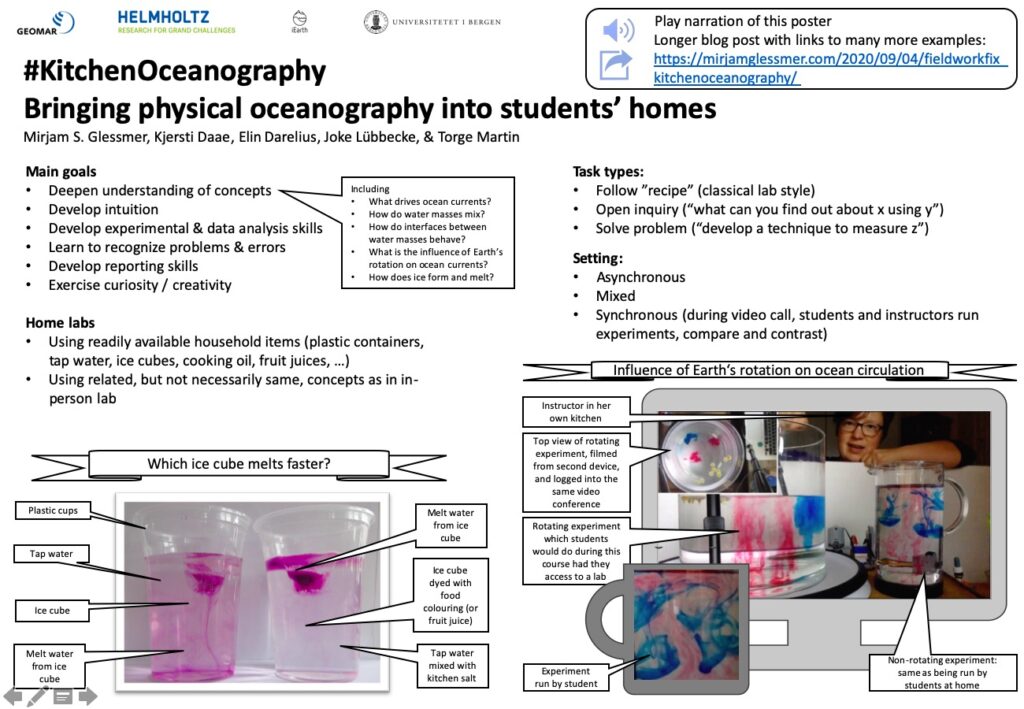
This is a (admittedly terribly crowded — but I only had 1 A4 page and there are so many interesting #BergenWaveWatching stories to tell!) poster that I am presenting on behalf of myself (Mirjam), Kjersti Daae and Elin Darelius at the #FieldWorkFix conference (September 8, 2020). If you would rather listen to my poster’s voiceover than read the transcript below, please feel free to do that here!
Welcome to our poster!
The most important learning outcomes that, in my opinion, need to be achieved with a #FieldWorkFix are to enhance motivation and interest in concepts that are being dealt with theoretically in class, and in the students’ subject in general. When students are isolated in their homes and don’t have an inspiring community of learners in their field around them, it is so important to maintain a connection to their field of study! And one way to do that is by helping them realize that what they study is relevant and meaningful in the way that it helps them explain the world they see (even if they previously neither noticed nor felt the need to explain the waves on a puddle they accidentally stepped in).
There are different types of tasks that can help students achieve that level of observation and fascination with their subject (and if you are interested in what specific tasks can look like, check out the link on our poster, that will lead you to a blog post that links to all the different examples I am giving in the following, with tons of pictures).
For example, students could be asked to find realizations of a phenomenon in the world around them. It’s good to start with an easy example that they can definitely find in many different locations. In our case, “find a hydraulic jump” works well, because those can be generated artificially by turning on the tap in your sink, or can be observed near any weir, most rain gutters, and many rivers. These examples can be shared via the classes content management system or via social media – both work well and offer the added benefit of requiring some sort of description and explanation of what was observed and where, thereby practicing both note-taking and reporting skills.
Students could also be asked to observe a specific phenomenon in a specific place and discuss how the time of observation might have influenced what they saw, and how they would set up a schedule for observations that would be best suited to document the phenomenon. An example for that is looking at a tidal current underneath a specific bridge. Depending on what time and what day it is observed during the spring and neap cycle, the flow might be observed having different strengths or even going in different directions.
I am also a big fan of the more open “find something interesting to observe that is somehow related to the concepts discussed in class”, and being open to what students come up with. If you are worried about students not finding something interesting, I would encourage you to look at my Instagram @fascinocean_kiel, where I have almost 900 pictures of mainly waves (and a few other interesting oceanic phenomena) with explanations of what I saw. Once you start looking, there is physics everywhere!
The best thing about a collection like the one on my Instagram (or the one you are building by asking students to document their observations) is that they can be used for an indoor version of this #FieldWorkFix: Assigning pictures to students with the task to annotate and explain what they see. (Which is surprisingly difficult! I get often sent #FriendlyWaves; pictures of water with the request to explain what is going on there, and while it is very entertaining and educational, it is also really difficult because many of the relevant metadata does not come with a picture).
And finally, one could give the very open task to either come up with, or answer a given, research question by doing observations in the neighbourhood.
Depending on the social distancing requirements, all these tasks could be assigned to students working either in teams or by themselves. But if one of the learning outcomes is to practice working in teams, as it often is, this can be accommodated either way:
Several students can work together on the same research question and either do this together, or – which is most likely the mode they would choose in any case – divide work and take turns taking observations. This means they are also developing observational and collaboration skills: all have to be on the same page when it comes to what properties to observe by which methods and at what place and time, how to document, how much and what kind of metadata needs to be archived, how work is split between the students, et cetera.
Students could also be given complementing tasks that they each complete individually, knowing that they will ultimately have to put their results together like a puzzle. This, again, practices a lot of observational and communication skills.
The results of these tasks can be brought together either asynchronous, i.e. students report back in writing via the content management system or social media, or synchronous in video calls where students give presentations and there is a group discussion.
Lastly, one of the big learning outcomes often associated with field work is building students’ “identity as scientists”. Students come back from the field and talk about how we, meaning we oceanographers, or more generally, we scientists, do field work. Of course, the experience of a local field trip is not the same as a multi-day research cruise. But looking for phenomena related to ones field of study has an effect on how one sees the world. Very quickly, students will look at the world with different eyes, seeing physics where other people see the sparkly ocean or a fluffy cloud. This change in perception helps students feel like a specialist on their subject, as someone who has a deeper interest and wider knowledge than most people around them, and who looks at phenomena more carefully, trying to understand them. And this is a vicious circle: once hooked, it is difficult to stop looking at the world through that lens. Which is exactly what we wanted!
… read the article about our findings in Masfjorden that was published in Bergens Tidene, the local newspaper, this Monday! That’s a lot of people! The article is behind a pay-wall, but the journalist who wrote it, Atle, kindly allowed me to publish it here for those of you who missed it (and who reads Norwegian), so here it is: Her kan fjordbunnen være i ferd med å dø (Originally published in BT 7/7 2020)
Beautiful – but oxygen poor – Masfjorden
Luckily not everybody who read the article contacted me – but quite a few did; friends that I haven’t seen in ages who congratulating me on messenger, colleagues giving thumbs up on Teams, people writing me to ask if I know anything about the situation in “their” fjord and a few Norwegian scientists that I’ve never met who asked me to send them a copy of the original paper (which is freely available here)… a very positive experience, indeed!
BT and Atle are planning to write more about oxygen and fjords – and I’ve already volunteered to contribute 🙂