Why we actually need a large tank — similarity requirements of a hydrodynamic model

When talking about oceanographic tank experiments that are designed to show features of the real ocean, many people hope for tiny model oceans in a tank, analogous to the landscapes in model train sets. Except even tinier (and cuter), of course, because the ocean is still pretty big and needs to fit in the tank.

What people hardly ever consider, though, is that purely geometrical downscaling cannot work. Consider, for example, surface tension. Is that an important effect when looking at tides in the North Sea? Probably not. If your North Sea was scaled down to a 1 liter beaker, though, would you be able to see the concave surface? You bet. On the other hand, do you expect to see Meddies when running outflow experiments like this one? And even if you saw double diffusion happening in that experiment, would the scales be on scale to those of the real ocean? Obviously not. So clearly, there is a limit of scalability somewhere, and it is possible to determine where that limit is – with which parameters reality and a model behave similarly.

Similarity is achieved when the model conditions fulfill the three different types of similarity:

Geometrical similarity
Objects are called geometrically similar, if one object can be constructed from the other by uniformly scaling it (either shrinking or enlarging). In case of tank experiments, geometrical similarity has to be met for all parts of the experiment, i.e. the scaling factor from real structures/ships/basins/… to model structures/ships/basins/… has to be the same for all elements involved in a specific experiment. This also holds for other parameters like, for example, the elastic deformation of the model.

Kinematic similarity
Velocities are called similar if x, y and z velocity components in the model have the same ratio to each other as in the real application. This means that streamlines in the model and in the real case must be similar.

Dynamic similarity
If both geometrical similarity and kinematic similarity are given, dynamic similarity is achieved. This means that the ratio between different forces in the model is the same as the ratio between different scales in the real application. Forces that are of importance here are for example gravitational forces, surface forces, elastic forces, viscous forces and inertia forces.

Dimensionless numbers can be used to describe systems and check if the three similarities described above are met. In the case of the experiments we talk about here, the Froude number and the Reynolds number are the most important dimensionless numbers. We will talk about each of those individually in future posts, but in a nutshell:

The Froude number is the ratio between inertia and gravity. If model and real world application have the same Froude number, it is ensured that gravitational forces are correctly scaled.

The Reynolds number is the ratio between inertia and viscous forces. If model and real world application have the same Reynolds number, it is ensured that viscous forces are correctly scaled.

To obtain equality of Froude number and Reynolds number for a model with the scale 1:10, the kinematic viscosity of the fluid used to simulate water in the model has to be 3.5×10⁻⁸m2/s, several orders of magnitude less than that of water, which is on the order of 1×10⁻⁶m2/s.

There are a couple of other dimensionless numbers that can be relevant in other contexts than the kind of tank experiments we are doing here, like for example the Mach number (Ratio between inertia and elastic fluid forces; in our case not very important because the elasticity of water is very small) or the Weber number (the ration between inertia and surface tension forces). In hydrodynamic modeling in shipbuilding, the inclusion of cavitation is also important: The production and immediate destruction of small bubbles when water is subjected to rapid pressure changes, like for example at the propeller of a ship.

It is often impossible to achieve similarity in the strict sense in a model experiment. The further away from similarity the model is relative to the real worlds, the more difficult model results are to interpret with respect to what can be expected in the real world, and the more caution is needed when similar behavior is assumed despite the conditions for it not being met.

This is however not a problem: Tank experiments are still a great way of gaining insights into the physics of the ocean. One just has to design an experiment specifically for the one process one wants to observe, and keep in mind the limitations of each experimental setup as to not draw conclusions about other processes that might not be adequately represented.

So much for today — we will talk about some of the dimensionless numbers mentioned in this post over the next weeks, but I have tried to come up with good examples and keep the theory to a minimum! 🙂

Of swirls, eddies and fairy dust

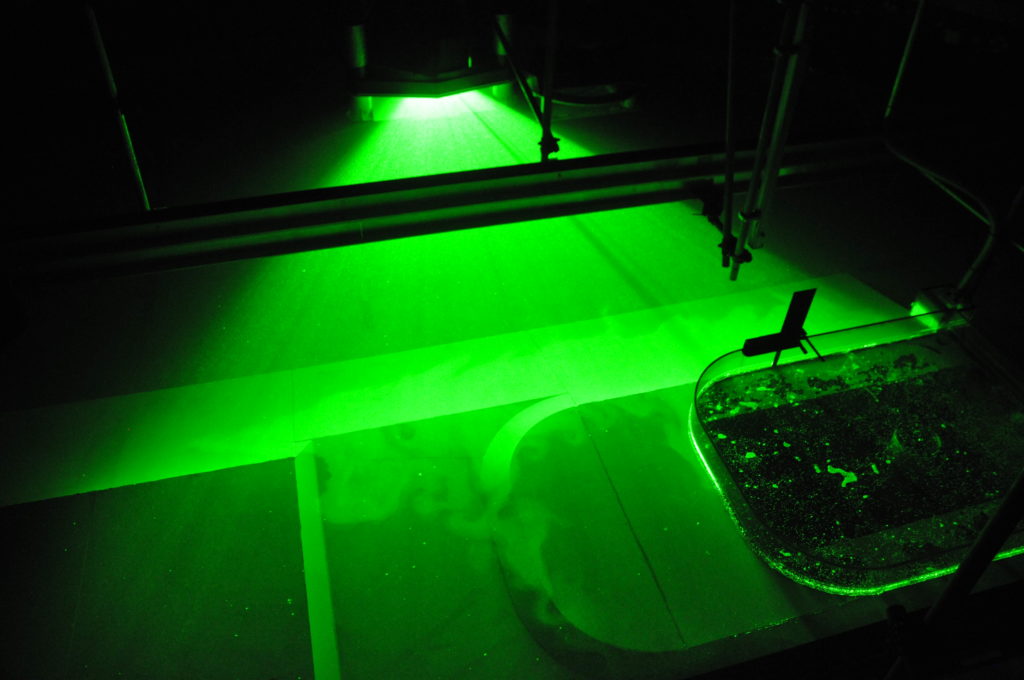
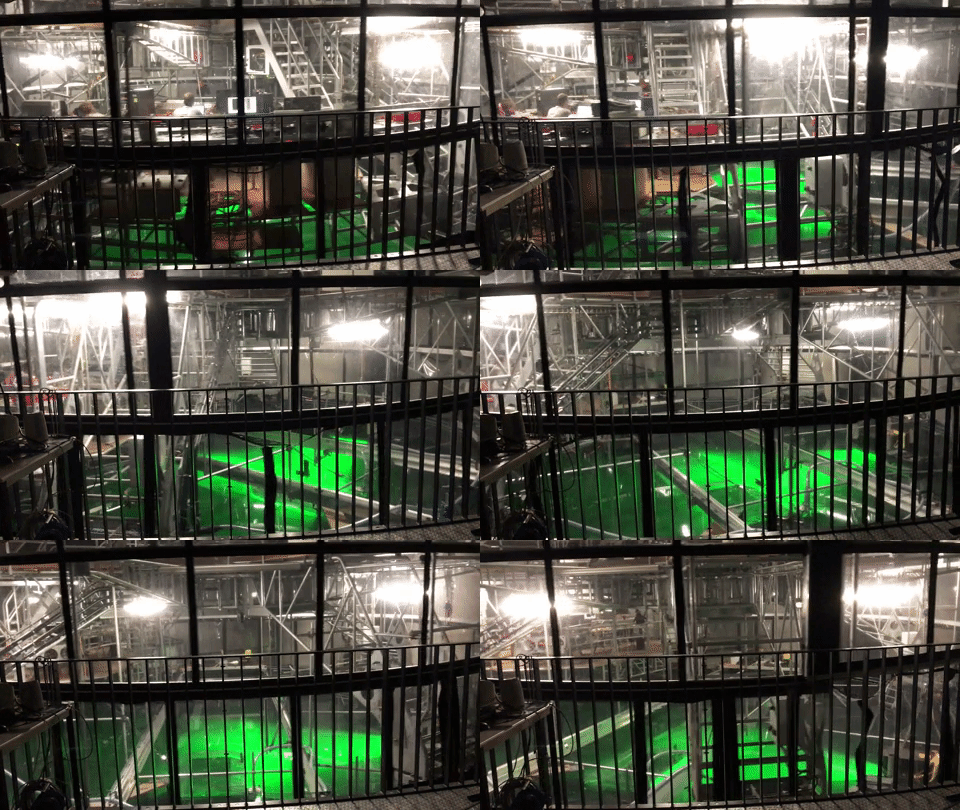
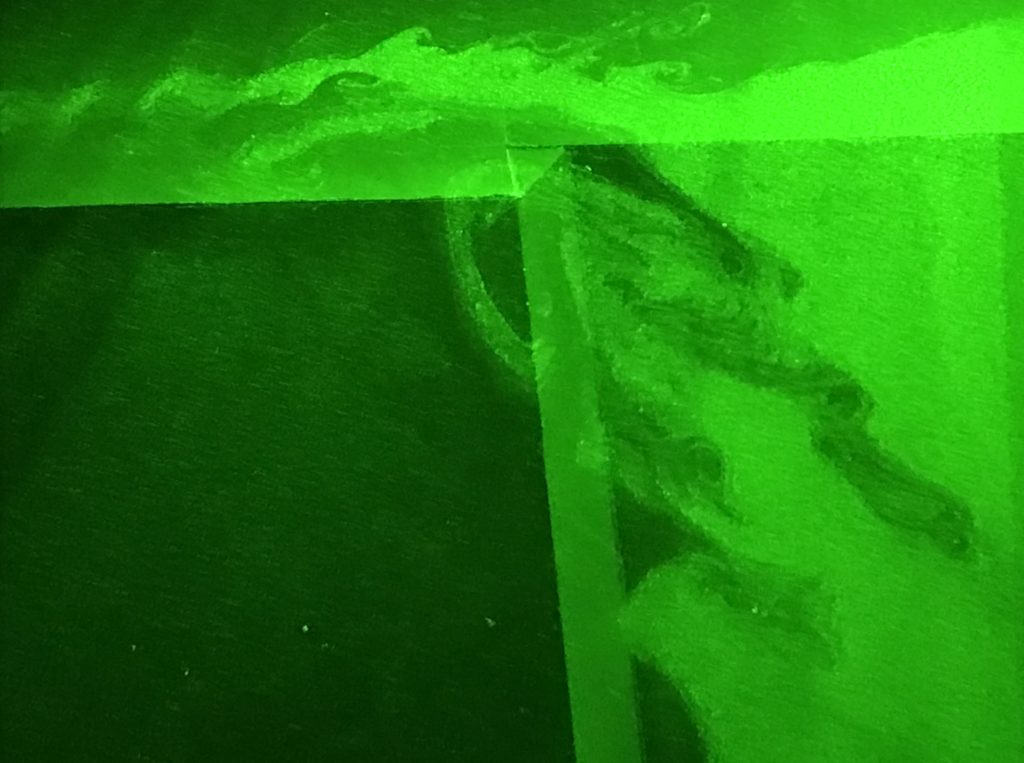
Similarly to last Friday’s Kelvin-Helmholtz instabilities, observing swirls and eddies made from green fairy dust is not really what we are in Grenoble for. But are they pretty!

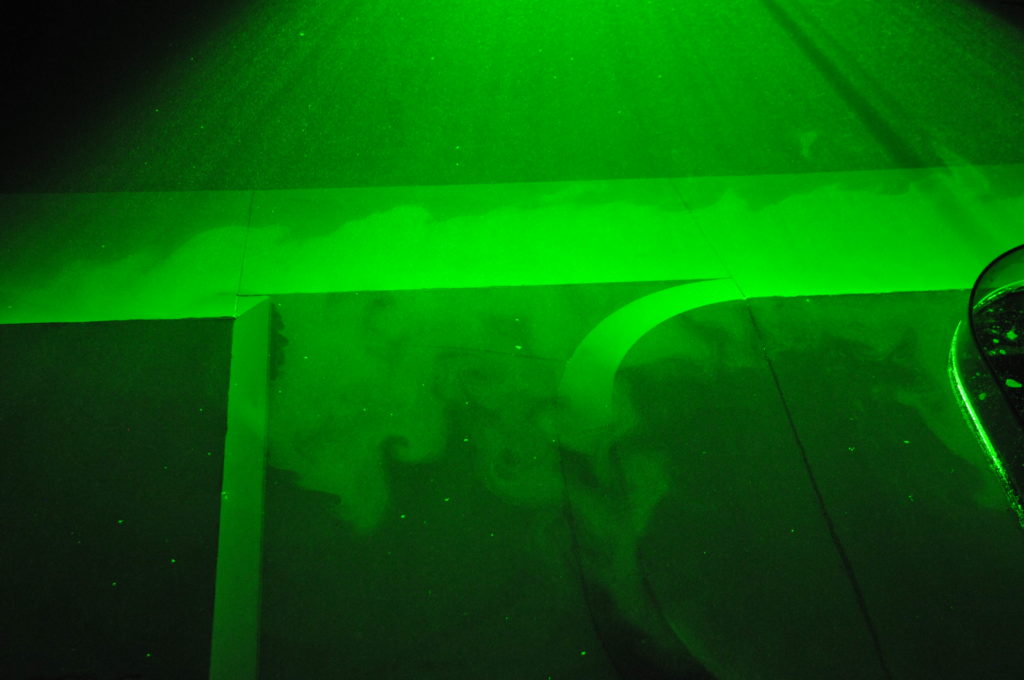
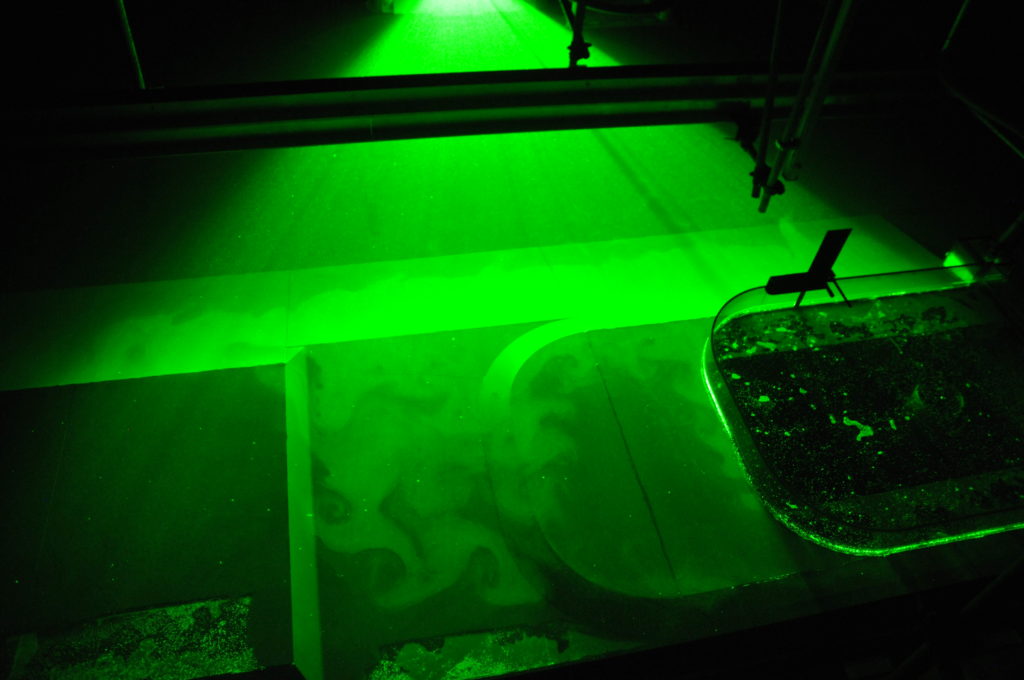
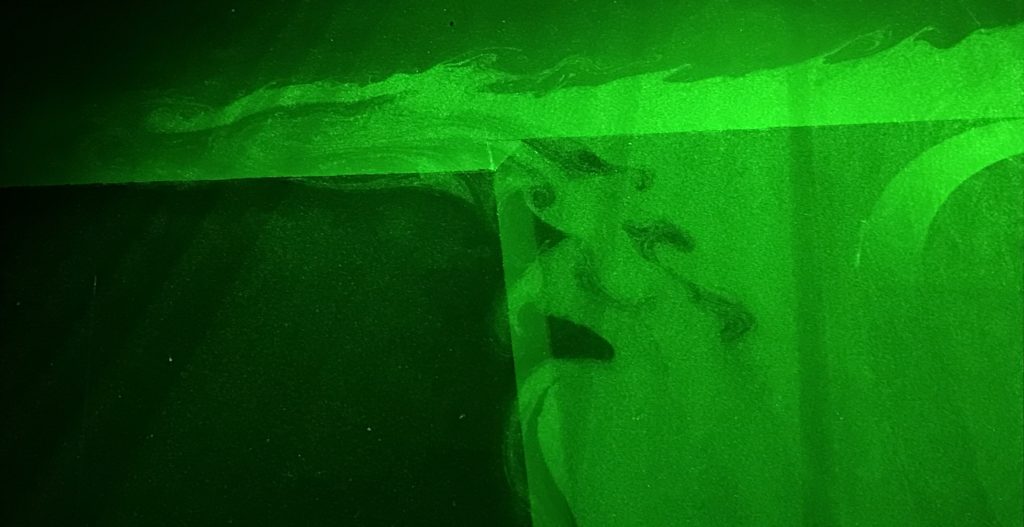
And it is actually very interesting to observe the formation of eddies. If you look at the picture above and focus on the sharp edge “downstream” of the canyon, you see that there are some small instabilities forming there that detach as eddies. And in the picture below you see that there are more, and larger ones, a little while later.

And below you see how they have grown into larger eddies.

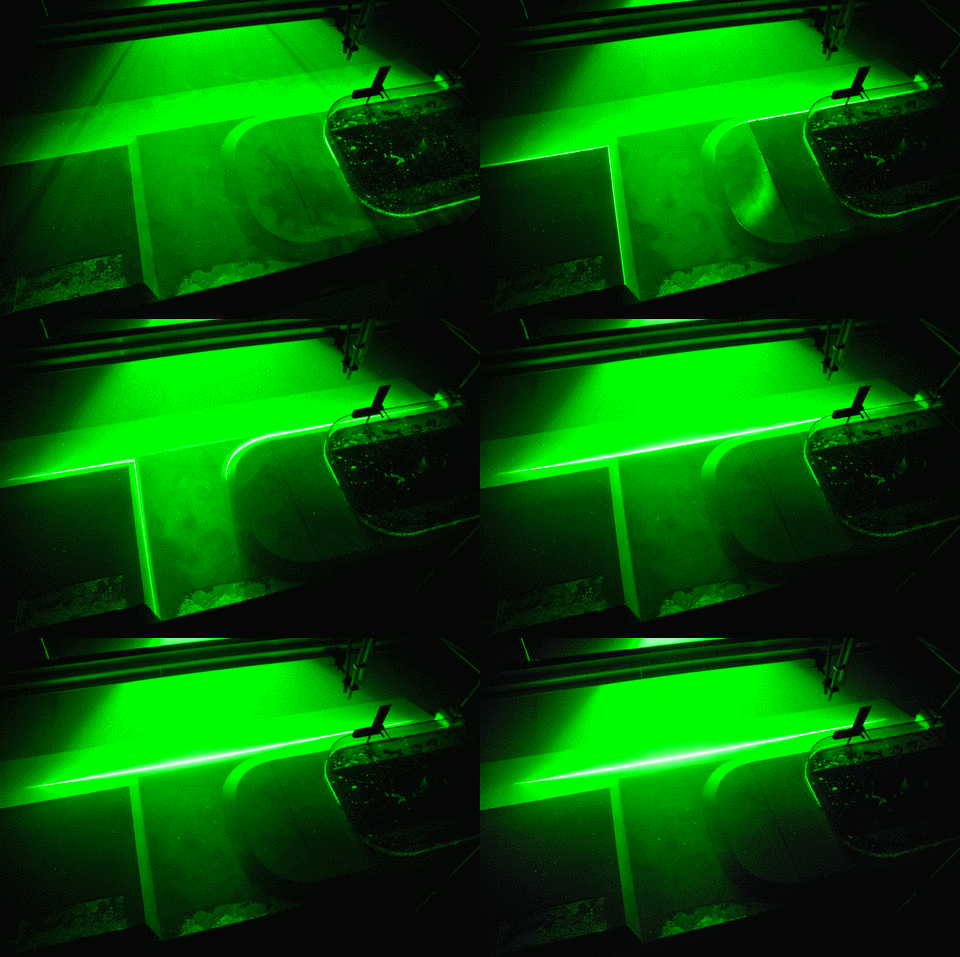
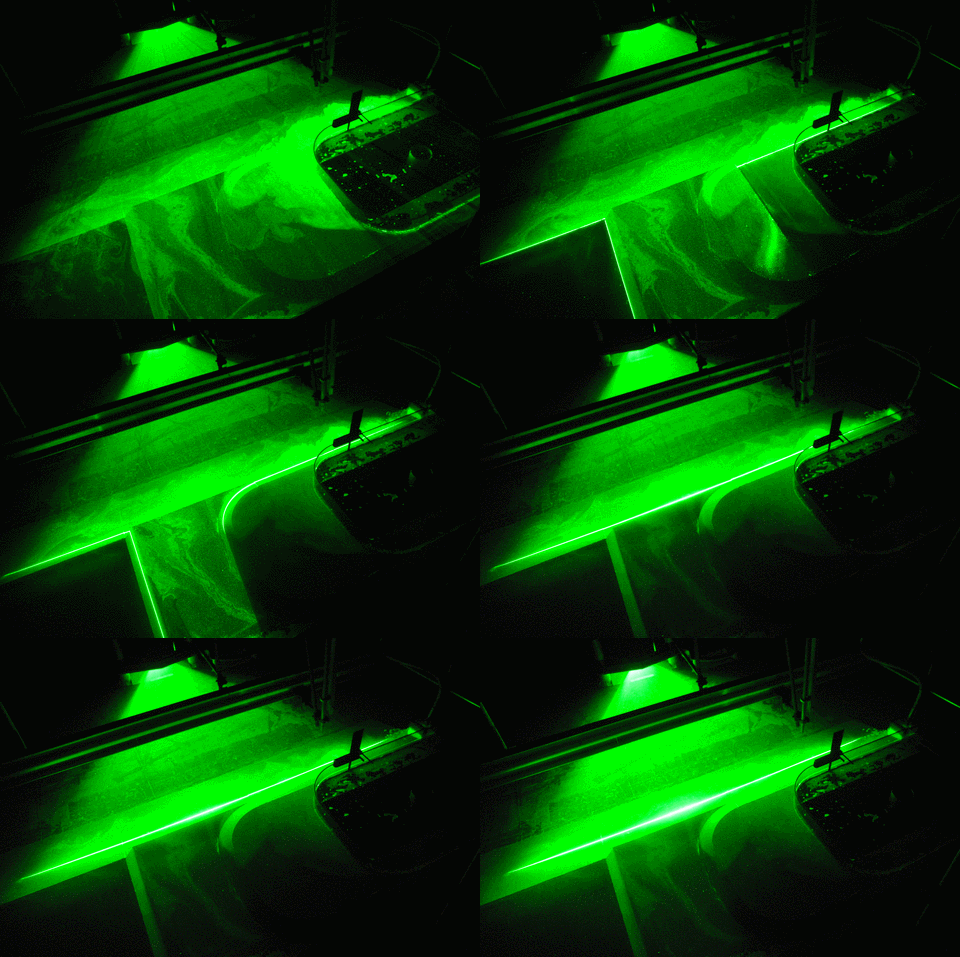
And in the gif below you see that the structures of those eddies inside the canyon are actually coherent throughout the uppermost three layers (which are the only ones in which the shelf is lit, for the lower three layers we can just observe what’s going on deeper than the depth of the canyon). So a nice and barotropic flow, just like we had hoped!

Don’t those eddies look just like phytoplankton patches observed from a satellite?

Why are we rotating a huge tent with our tank?

When watching the images or movies that show the rotating tank from the outside, you may have been wondering about why the whole structure — tank, office above the tank, everything — is inside a rotating tent, which itself is inside a large room.
Remember the last time you were on a merry-go-round? Remember the wind on your face and in your hair? Yes, that’s exactly what we don’t want. Neither for us sitting in the office, nor, more importantly, for our tank.
If there wasn’t a tent around the whole structure, rotating with it, we would always have “wind” on the tank’s free water surface, because the water would be in motion relative to the room in which the tank is located. The friction between air and water would then cause wind-driven surface currents, which might disturb our experiments. Now, however, the air inside the tent is rotating with the tank, hence there is no motion of the air relative to the water, no wind, no wind-driven currents, perfect conditions for our experiments!
And believe me, when you step out of the tent on your way off the rotating platform, or from the stationary room onto the platform on your way in, you definitely feel the wind!

Adding salt to spice it up

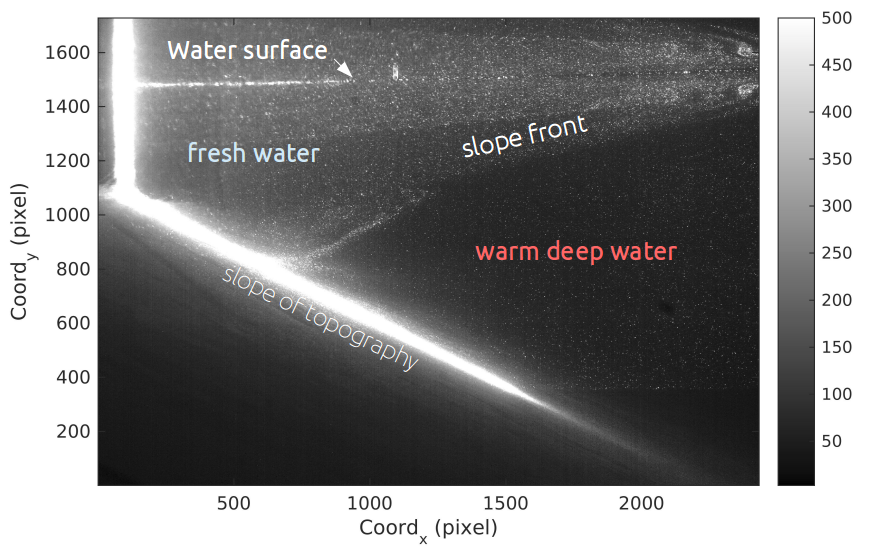
Today, we finally started some experiments that got us a bit closer to reality. The water in the tank is now salty, just like the Southern Ocean and the inflow is fresh, which produces a slope front. Remember, the slope front separates the warm deep water from the fresh shelf water influenced by the ice shelfs. The slope front makes it difficult for the warm deep water to get onto the continental shelf. We already wrote more about the ‘Antarctic Slope Front’ in a previous post (https://elindarelius.no/2017/09/19/a-bit-more-about-real-antarctica/).

On a photo of the camera of a cross section through the current you can actually nicely see this slope front!

Photos of the cross section of the inflow show the slope front that separates the fresh water from the salt water


To actually measure the change in density with depth, we attached 5 probes just above the current that do profiles of the water column. They measure the conductivity and temperature, from which we calculate the density. So, it is exactly the same as CTDs (conductivity – temperature – depth) that we use on the ship in Antarctica—just in miniature.

The 5 conductivity-temperature sensors that measure profiles of the water column to give us density profiles with depth.


After a while, the fresh water spreads out at the surface and forms a surface layer. When the laser crosses the interface between this surface layer and the salty subsurface layer it gets deflected, which we want to avoid. Therefor we were allowed to go into the tank and mix the water 🙂

To mix the fresh and the dense water, we were finally allowed to enter the pool while filled with water!


Totally not the focus of our experiments, but so beautiful! Kelvin-Helmholtz instabilities

This is really not the focus of our experiments here in Grenoble, but they are too nice not to show: Kelvin-Helmholtz instabilities!

They showed up really nicely in our first experiment, when we only had neutrally-buoyant particles in our source water (and not yet in the ambient water). The water that shows up as the lighter green here is thus water that originally came from the source (and at this point has recirculated out of the canyon again).

I get so fascinated with this kind of things. How can anyone possibly not be interested in fluid dynamics? 🙂

Watch the movie below to see them in motion! The scanning works as explained here.

Idealised modeling in a different way

Written by Svenja Ryan

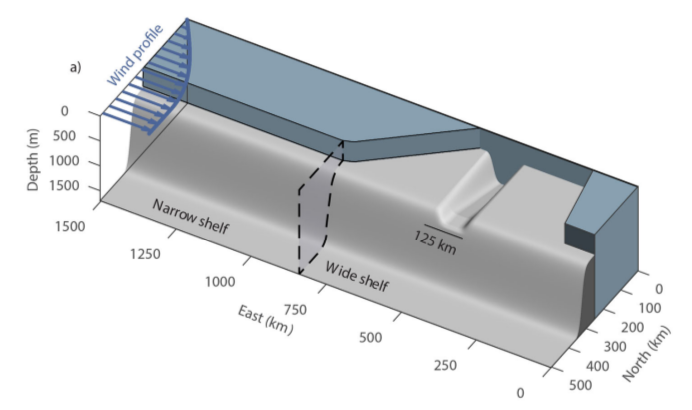
After our excursion to ‘real’ Antarctica, we are back in the idealised world. Hopefully you all have followed the blog and have seen how our continental shelf has been constructed and the source for our current has been tested. The same thing has been done by one of our colleagues, Kjersti, on the computer to then run it with a regional ocean model. In Figure 1 you can see the similarity of the set-up that she created to the one in our tank. The advantages of here experiments are that she can add a wind-forcing of any strength at the surface and can also change the surface temperature and salinity fields to mimic the seasonally varying effect of sea ice. Furthermore, she located a dense source at the end of the trough representing the dense water outflow.

Idealized model configuration from Daae et al., 2017. The model domain consist of a narrow and a wide shelf region with a trough cross-cutting the wide shelf. The set-up is based on the shelf on front of the Filchner Ice shelf. The blue arrows indicate the imposed zonal wind profile.

In her recent publication (Daae et al., 2017) she uses this model to study the sensitivity of the warm deep water entering a continental shelf with a coastal trough to the magnitude of wind stress, the shelf salinity and the upper-layer hydrography. She finds that stronger along-slope winds create a stronger slope current which is also shifted toward shallower isobaths, causing a stronger interaction of the flow with the trough. At low wind speeds the core of the current is located below the depth of the sill and is not affected. The southward transport of warm deep water increases for a denser outflow and higher salinities on the shelf. This effect is stronger for weak winds compared to strong winds, potentially because a strong barotropic flow passing the mouth of the trough will create less baroclinic instabilities.

They find that the warm deep water mainly accesses the shelf when no work against the buoyancy force has to be done. This is the case when dense water on the shelf connects the density surfaces between the shelf and off-shelf water masses. Furthermore, more warm water is found on the shelf in summer, when a fresh surface layer is present due to the sea ice melting. It induces a shallow eddy overturning cell that acts to flatten the isopycals, hence providing easier access to the shelf.

You see that you can sort of play god with these models, but you actually have to be very careful to choose all your parameters correctly and in a way that they representable for the processes in nature. Handled with care, models provide another important tool for understanding the climate system and individual processes.

Daae, K. B., Hattermann, T., Darelius, E., & Fer, I. (2017). On the effect of topography and wind on warm water inflow – An idealized study of the southern Weddell Sea continental shelf system. Journal of Geophysical Research : Oceans, 122, 2017-2033. http://doi.org/10.1002/2016JC012541

About neutrally buoyant particles, popcorn, and more bubbles

When you see all our pretty images of currents and swirling eddies and everything, what you actually see are the neutrally buoyant particles, specifically added for this purpose, that get lit by the laser in a thin sheet of light. And those particles move around with the water, but in order to show the exact movement of the water and not something they are doing themselves, they need to be of the exact same density as the water, or neutrally buoyant.

But have you ever tried creating something that just stays at the same depth in water and does neither sink to the bottom or float up to the surface? I have, and I can tell you: It is not easy! In fact, I have never managed to do something like that, unless there was a very strong stratification, a very dense lower layer in which stuff would float that fell through a less dense upper layer. And in a non-stratified fluid even the smallest density differences will make particles sink or float up, since they are almost neutral everywhere… One really needs stratification to have them float nicely at the same depth for extended periods of time.

But luckily, here in Grenoble, they know how to do this right! And it’s apparently almost like making popcorn.

You take tiny beads and heat them up so they expand. The beads are made from some plastic like styrofoam or similar, so there are lots of tiny tiny air bubbles inside. The more you heat them up, the more they expand and the lower the density of the beads gets.

But! That doesn’t mean that they all end up having the same density, so you need to sort them by density! This sounds like a very painful process which we luckily didn’t have to witness, since Samuel and Thomas had lots of particles ready before we arrived.

Once the particles are sorted by density, one “only” needs to pick the correct ones for a specific purpose. Since freshwater and salt water have different densities, they also require different densities in their neutrally buoyant particles, if those are to really be neutrally buoyant…

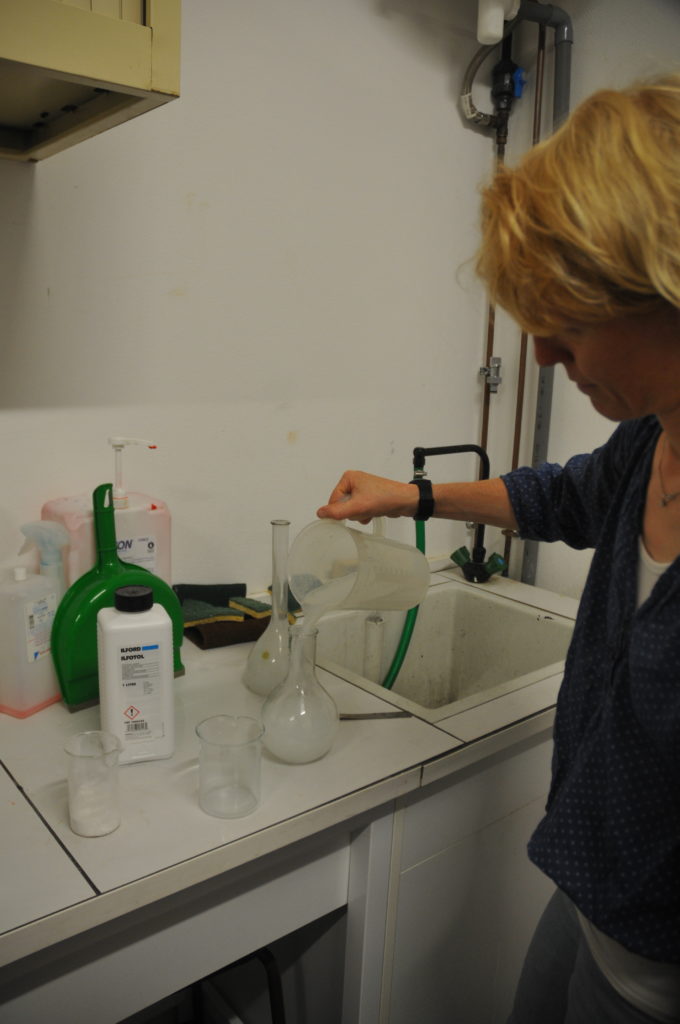
Below you see Elin mixing some of those particles with water from the tank so we can observe how long they actually stay suspended and when they start to settle to either the top or the bottom…

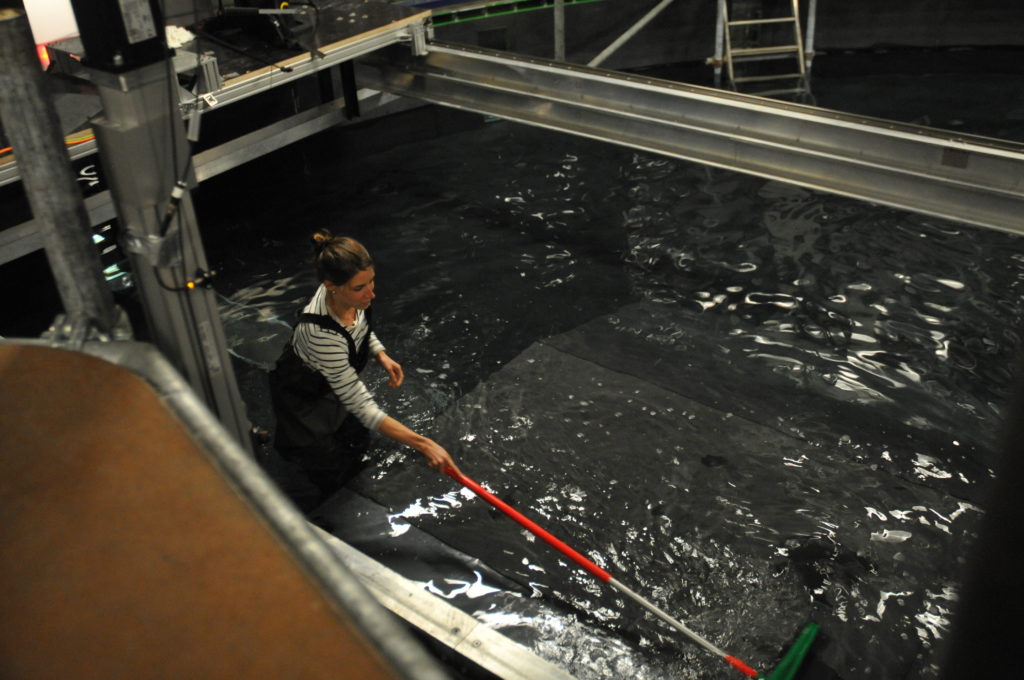
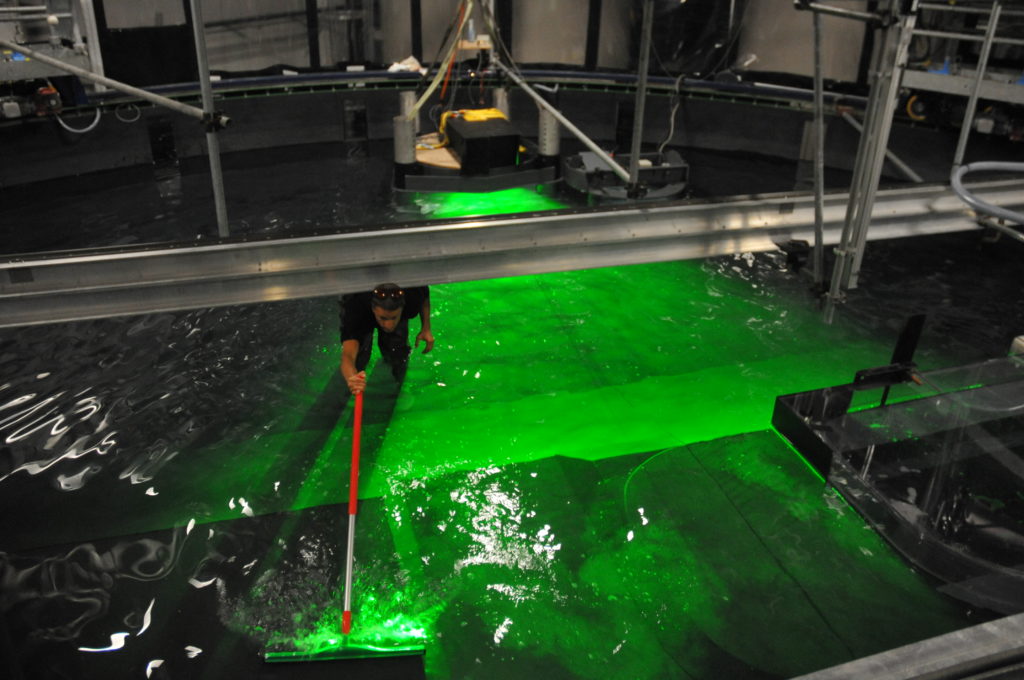
Turns out that they are actually very close to the density of the water in the tank, so we can do the next experiment as soon as the disturbances from a previous one have settled down and don’t have to go into the tank in between experiments to stir up particles and then wait for the tank to reach solid body rotation again. This only needs to be done in the mornings, and below you see Samuel sweeping the tank to stir up particles:

Also note how you now see lots of reflections on the water surface that you didn’t see before? That’s for two reasons: one is because in that picture there are surface waves in the tank due to all the stirring and they reflect light in more interesting pattern than a flat surface does. And the other reason is that now the tank is actually lit — while we run experiments, the whole room is actually dark except for the lasers, some flashing warning signs and emergency exit signs close to the doors and some small lamps in our “office” up above the rotating tank.

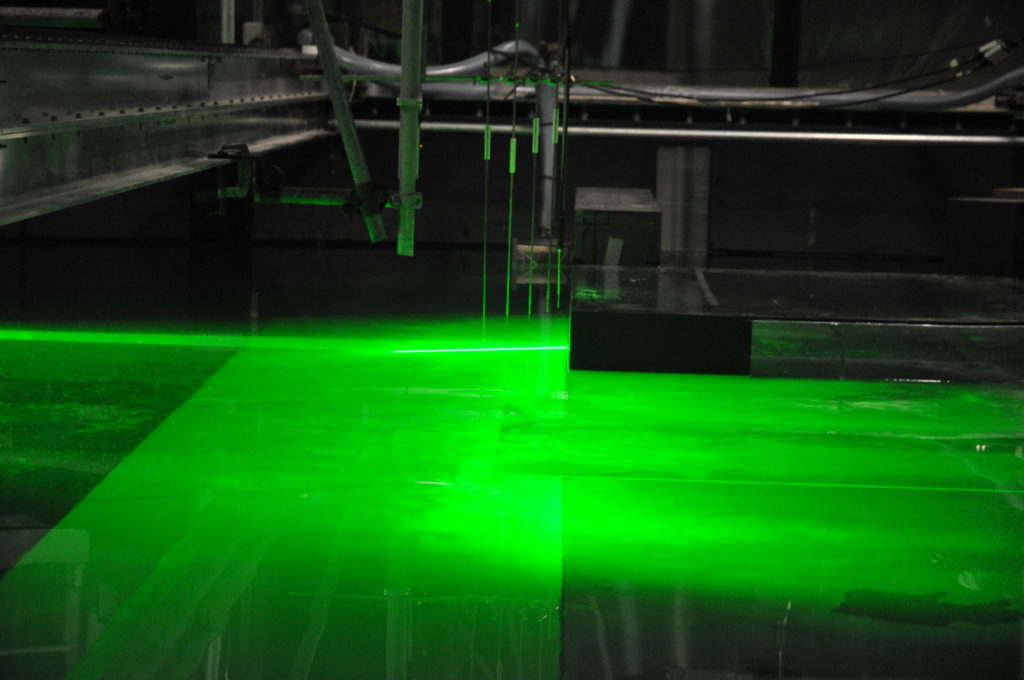
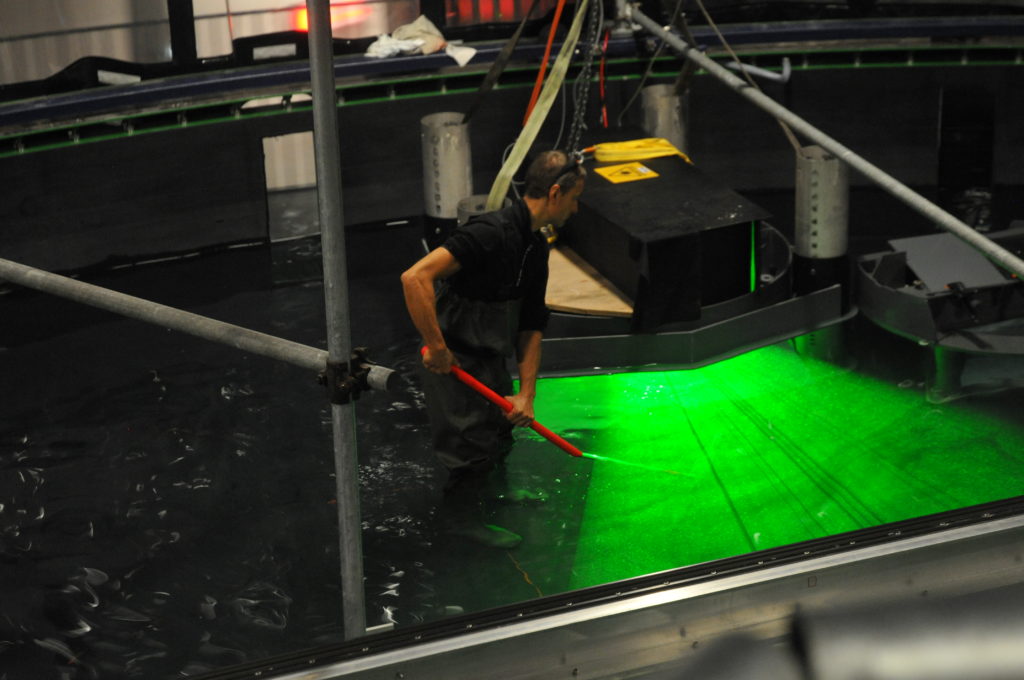
But now to the “more bubbles” part of the title: Do you see the dark stripes in the green laser sheet below? That’s because there are air bubbles on the mirror which is used to reflect the laser into the exact position for the laser sheet. Samuel is sweeping them away, but they keep coming back, nasty little things…

I actually just heard about experiments with a different kind of neutrally buoyant particles the other day, using algae instead of plastic. I find this super intriguing and will keep you posted as I find out more about it!

Turning images into data

Yesterday, the rotating tank was empty again and we used the whole day for an intensive session of data analyzing. Why was the tank empty again? We realized that the source was too close to the first corner when we used high inflow rates, so that the flow was not completely established once we reached the first corner. Therefore, we decided to move the position of the source 2m back to have a more established flow once it reaches the first corner. Samuel and Thomas did a great job with building a new slope and moving the source. However, it took quite some time to dry the glue, so that we had an empty tank yesterday and used this opportunity to process the data.

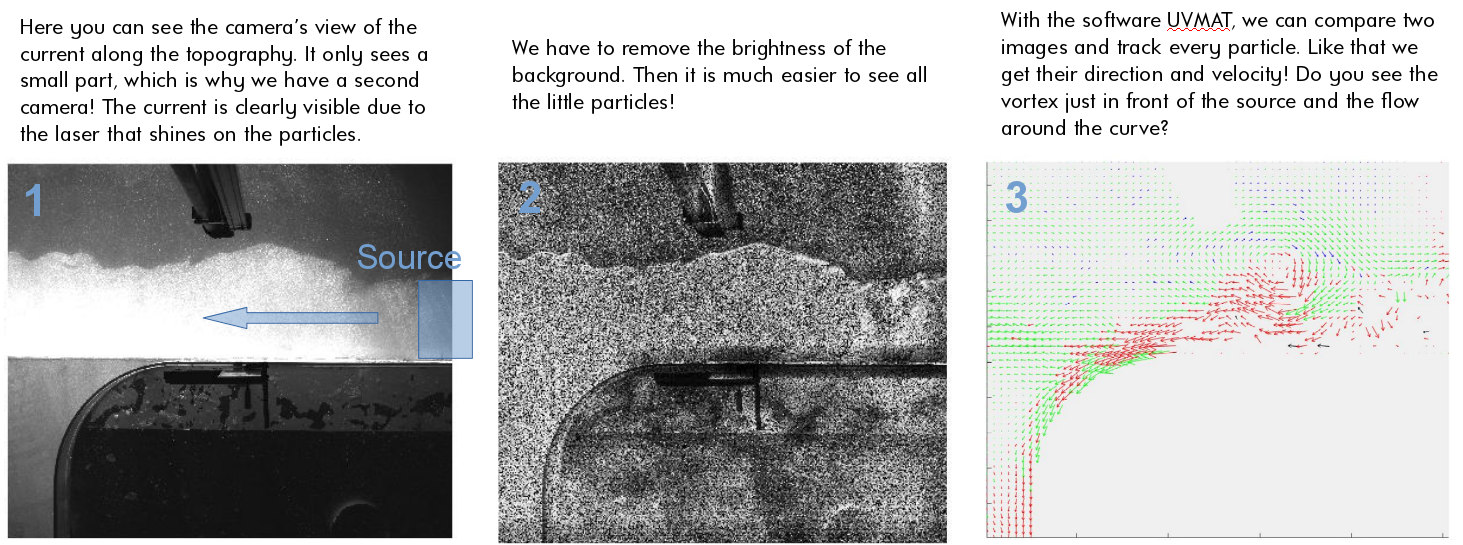
For the data processing, the people from the Coriolis platform provided us with the software UVMAT, which can conduct all the steps from the image to a velocity field. In a simplified way, the three images below show these different steps from one experiment that we did last friday.


A bit more about real Antarctica

Written by Svenja Ryan

We have already written about the article of Elin, where she shows that for the first time pulses of warm water have been measured in the vicinity of the ice front. This means that under certain conditions the warm water, can travel several hundred kilometers south along the eastern side of the Filchner depression, i.e. our trough. Of course everyone wants to know whether the trough provides a permanent pathway to the south for the warm water, which would be a big threat to the Filchner Ronne Ice Shelf.

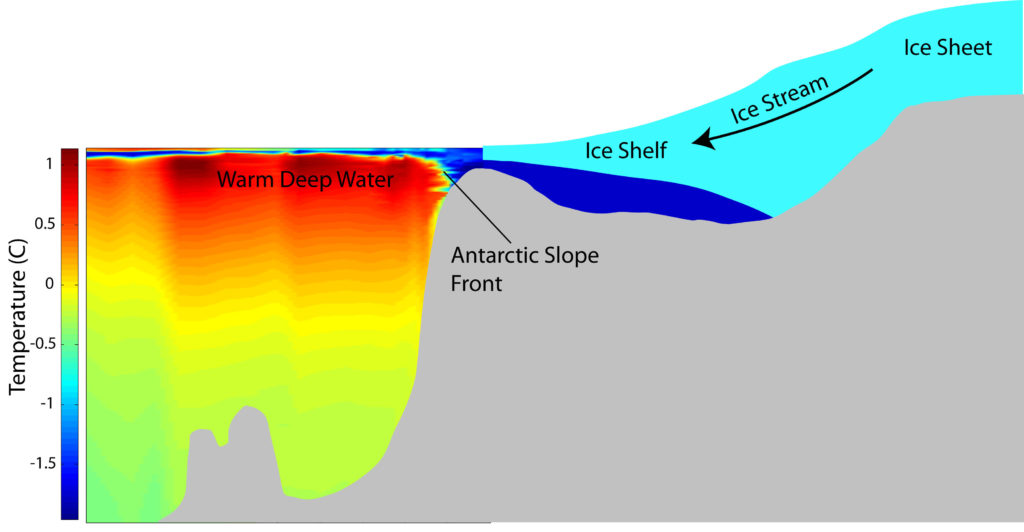
We will come back to this problem in a little while but first have to explain something that we call ‘Antarctic Slope Front’.  I think most of you are familiar with weather fronts, where for example cold and warm air meet. The same things exist in the ocean, when warm and cold or light and dense water masses encounter each other. This exactly is the cast almost all the way around Antarctica where fresh and cold water is found on the continental shelf and warm water (CDW/WDW) flows along the continental slope. The resulting front is the Antarctic Slope Front (ASF) as show in Figure 1. The depth of this front determines whether the deeper warm water can access the continental shelf or not. During our experiments we will also introduce a density difference at some point by have saline water in the tank and a fresh source.

Figure 1: A cross-section of the land ice – shelf ice – ocean system, showing the cold water on the continental shelf and below the ice shelf and the warm water situated just off the coast. (Illustration: Ole Anders Nøst, Norwegian Polar Institute).

Several mechanisms can influence the ASF such as the wind and the upper-layer hydrography, both having a strong seasonal cycle. Therefore, it is no surprise that the ASF depth also varies seasonally and it has been shown by various authors, that it is shallower in summer, favoring on-shelf flow of warm water and deeper in winter, reducing the access for warm deep water.

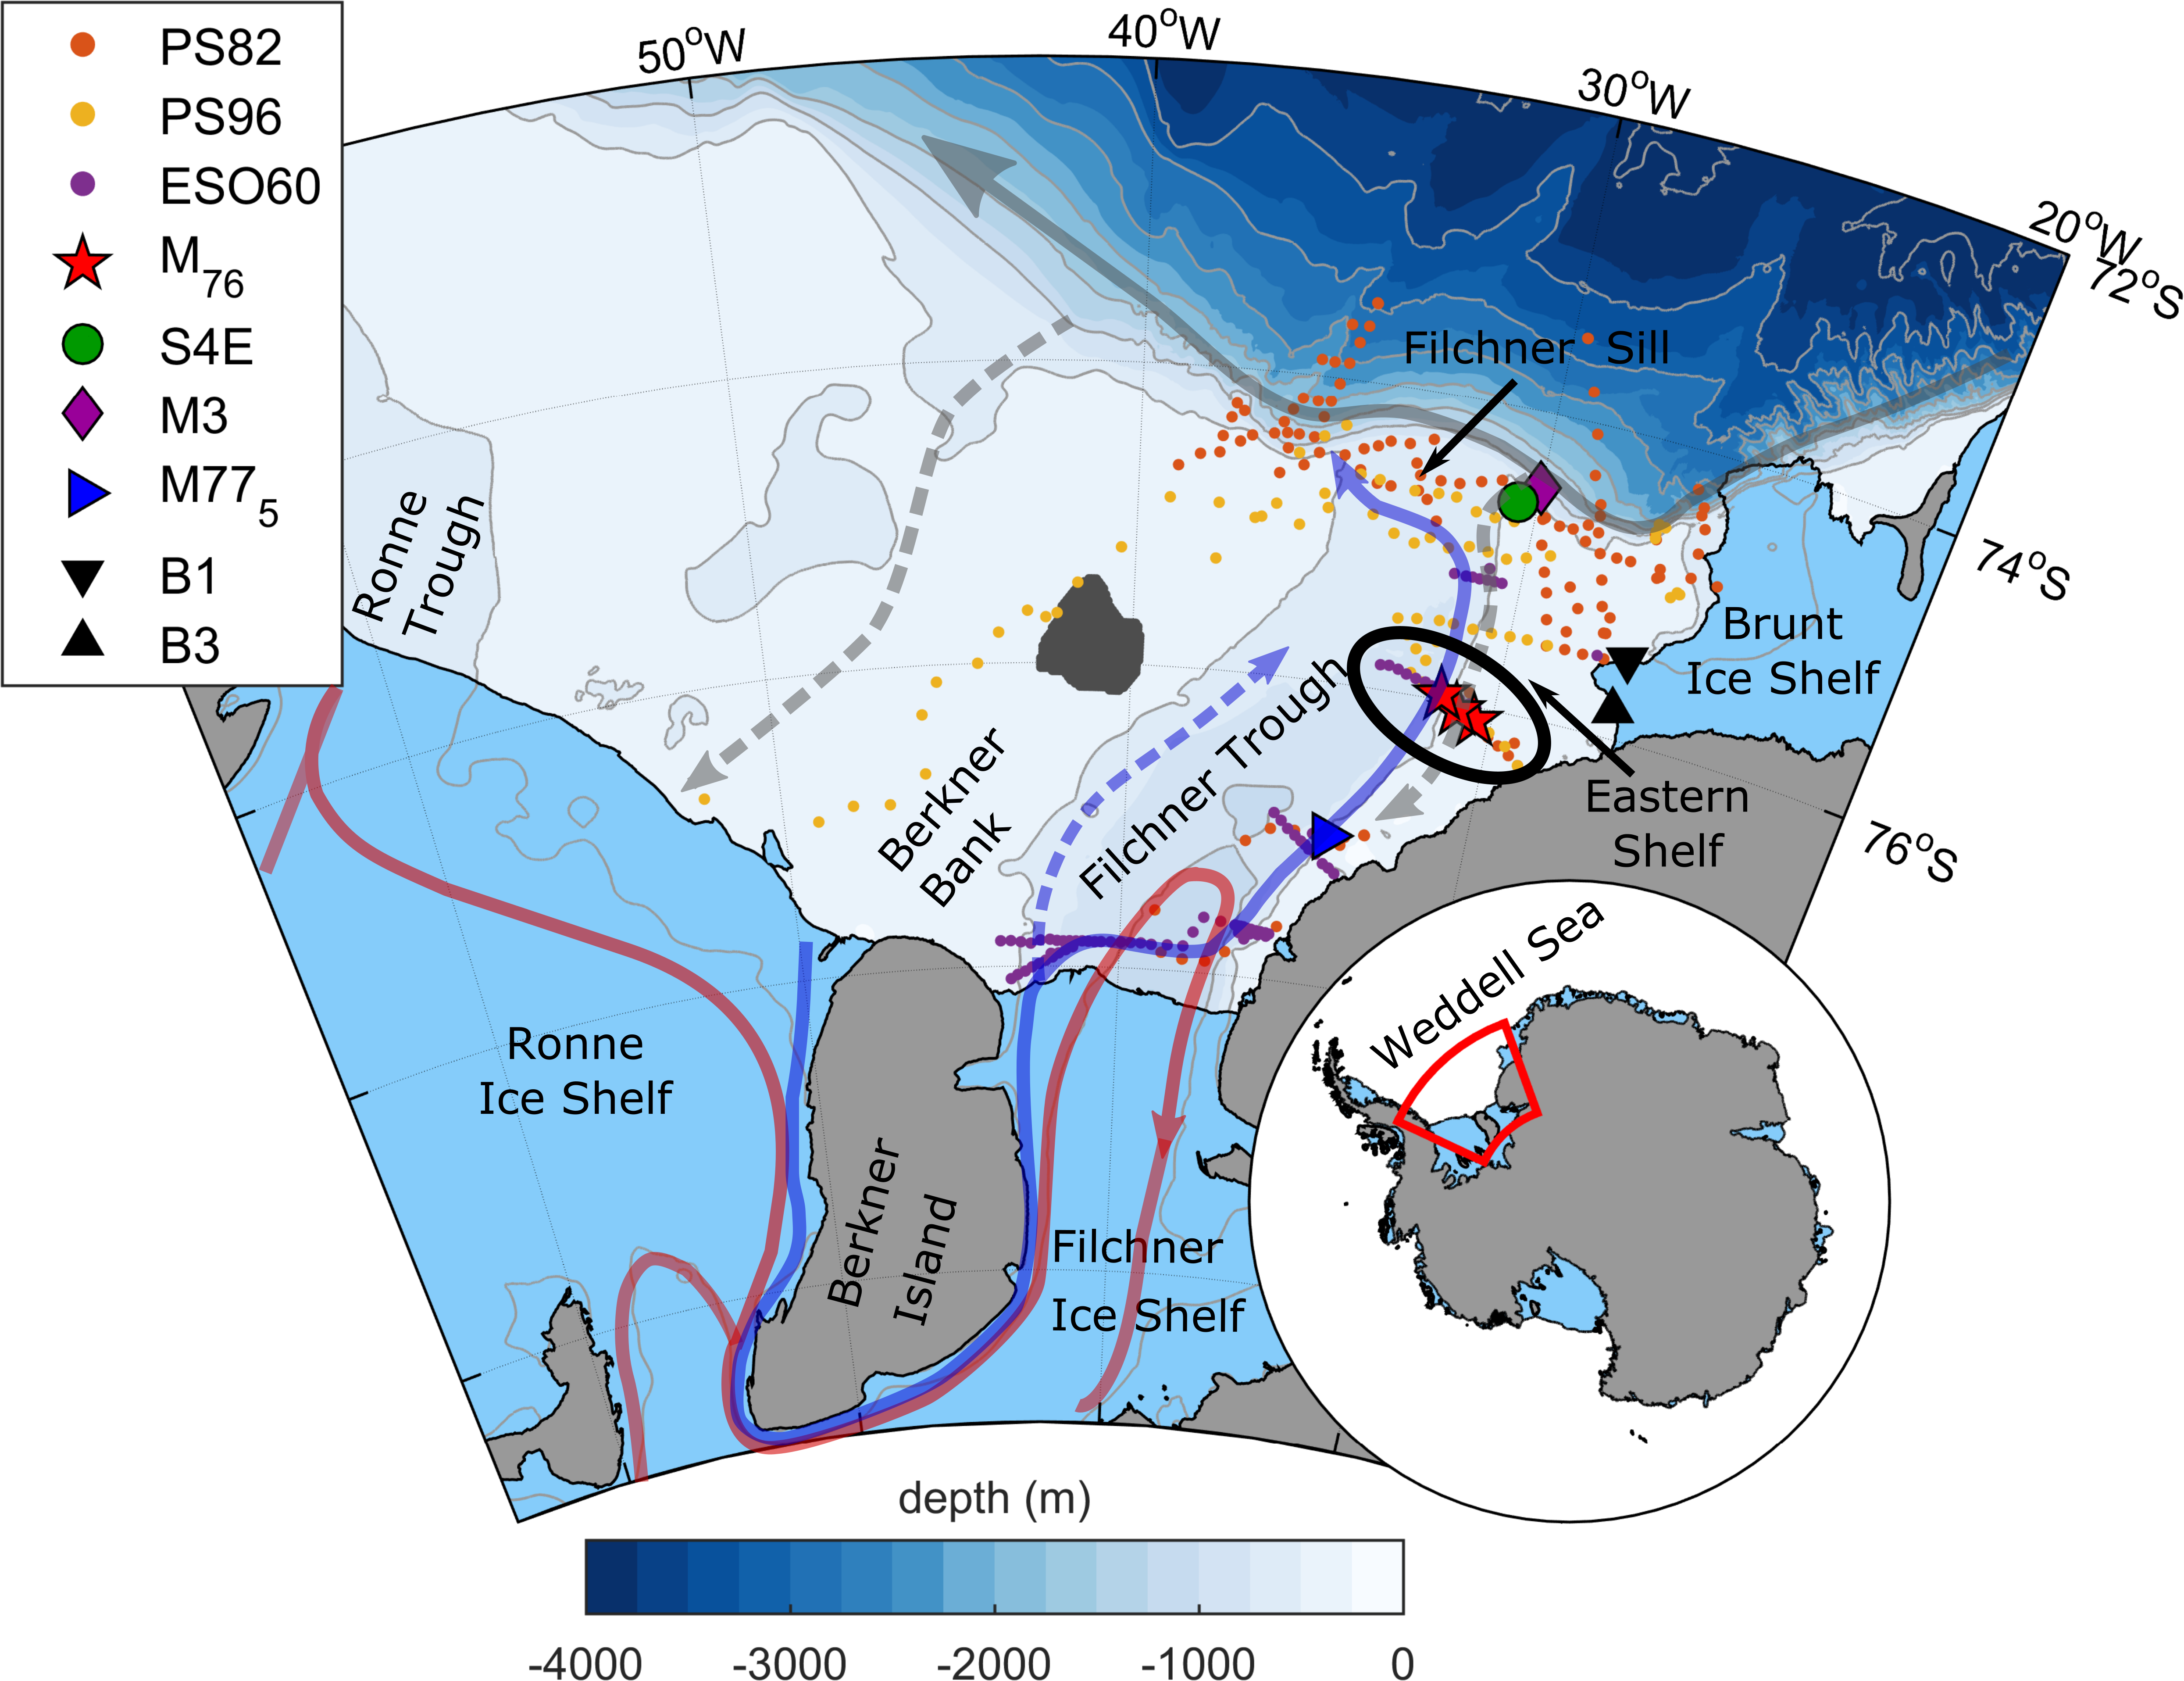
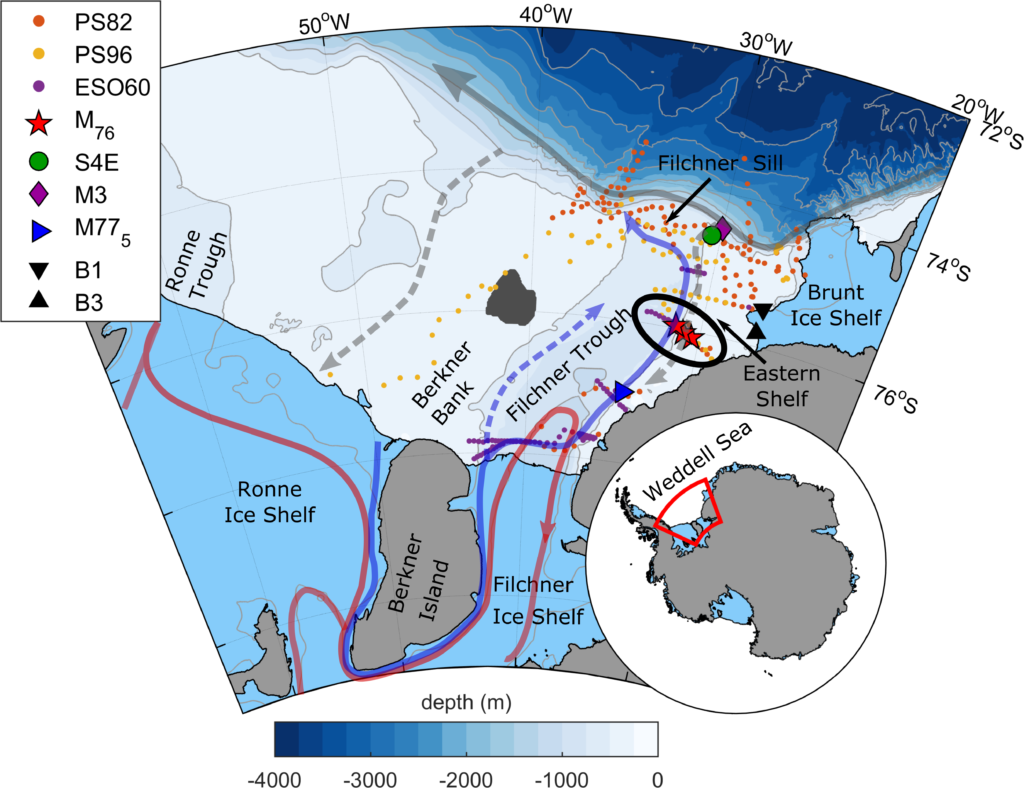
Figure 2: Station plot from Ryan et al., 2017 with the warm coastal current in grey and warm intrusions onto the continental shelf in dashed grey. Blue and red arrows show pathways of the cold water emerging from underneath the ice shelf. Coloured dots represent hydrographic stations and the other symbols moorings.

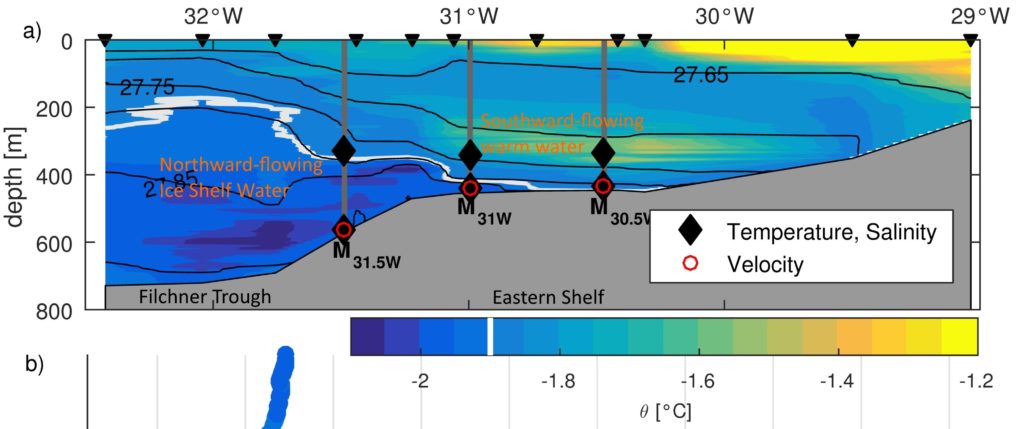
So, now we know that there might not be warm water available at the shelf break to flow toward the ice front at any time. Another important factor is whether the circulation on the continental shelf would transport the warm water toward the ice front all year around. Hence, we took the German ice breaker RV Polarstern and went to the Filchner region to put some more instruments in the water and I analyse the data in my recent publication (Ryan et al., 2017).  The map in Figure 2 should sort of look familiar to you now as it similar to the one in a previous article. You can see the coast to the right, then the continental shelf (Eastern Shelf) that opens up and the trough cross-cutting the shelf toward the Filchner Ice Shelf. We put moorings, i.e. a long upright floating lines with instruments at different depths, where the three red stars are on the map and left them there for two years. It is the eastern flank of the trough, where the warm water (dashed gray arrow) was observed to flow south adjacent to the northward flowing cold water, called Ice Shelf Water, emerging from underneath the ice shelf (blue arrow). You can see in Figure 3 how this looks like in a temperature section and where we took our measurements. You might wonder, why we did not put instruments shallower than 300m. If we did, we would risk these instruments to be ripped off by ice bergs, and there are plenty of them around. We found that there is only a certain period in summer-autumn, where we detect southward flowing warm water at our moorings. In winter, the water column becomes very cold and uniform with temperatures close to the surface freezing point and there is no southward flow anymore. So for now it seems like there is no permanent pathway for the warm water toward the Filchner Ice Front. However, in a warming climate the conditions on the continental shelf in winter could change, with warmer atmospheric temperatures and reduced sea ice production. The latter, could also reduce the production of ISW which is currently filling the whole trough and is sort of ‘blocking’ the warm water from entering the centre of the trough.

Figure 3: A temperature sections across the eastern flank of the trough (see black ellipse on Map for location) and the setup of the moorings.

Of course we do not have winds, ice etc. in our tank experiments but there is still so much more to be understood on how the warm water can be transported on the shelf and how for example the ASF changes in the vicinity of a coastal trough. Most measurements or time series are too short or too scattered in order to really understand fundamental processes and mechanisms, this is where a big rotating tank can help us!

Ryan, S., Hattermann, T., Darelius, E., & Schröder, M. (2017). Seasonal Cycle of Hydrography on the Eastern Shelf of the Filchner Trough, Weddell Sea, Antarctica. Journal Geophysical Research – Oceans. http://doi.org/10.1002/2017JC012916

#scipoem on an Darelius et al. article about ice shelves

“Observed vulnerability of Filchner-Ronne Ice Shelf to wind-driven inflow of warm deep water”*

Let’s talk ab’t a favourite paper
“Observed vulnerability of Filchner-
Ronne Ice Shelf to
wind-driven inflow
of wa(-a-a-a-a)rm deep water”

An ice shelf is ice that is floating
on top of the sea as it’s flowing
down from a continent
this one is prominent
more ar’onl’ the Ross Shelf is coating.

In oc’nographers’ jargon, “deep water”
(as we learned by heart at my alma mater)
are defined by their propertie’
and live in the deep, deep sea
and currently they are getting hotter.

But “warm” is a relative measure
bathing in it would be no pleasure
it’s temperature typically
less than just one degree!
Go measure yourself at your leisure!

As winds weaken now during summer
warm water, like led by a plumber,
climbs up the continent
and can now circumvent
sills and reach ice from under.

If temperatures rise as projected
a lot of the ice will be ‘ffected.
Raising the lev’l o’ sea,
changing hydrography,
which needs to be further dissected.

Because of its climatic impact
which Elin has now shown to be fact
we need close observation
of deep water formation
so all changes can carefully be tracked.

*that’s the title of an article by (Elin) Darelius et al. (2016) which served as inspiration for this poem.