

You’ve heard us talk a lot about rotating swimming pools. Nadine has written about why we care about Antarctic ice shelf melting (link), why the ice shelf is melting (link) and how we are going to investigate it (link). Today, I am going to bring those explanations together with all that you’ve seen so far about our experiments in Grenoble. I hope! 🙂
Let’s start with a technical drawing of our “Antarctica”, the topography we have in the middle of the tank. You have seen it in many of our previous posts: It’s the thing that used to be in clear plastic, but that one early morning got painted black.
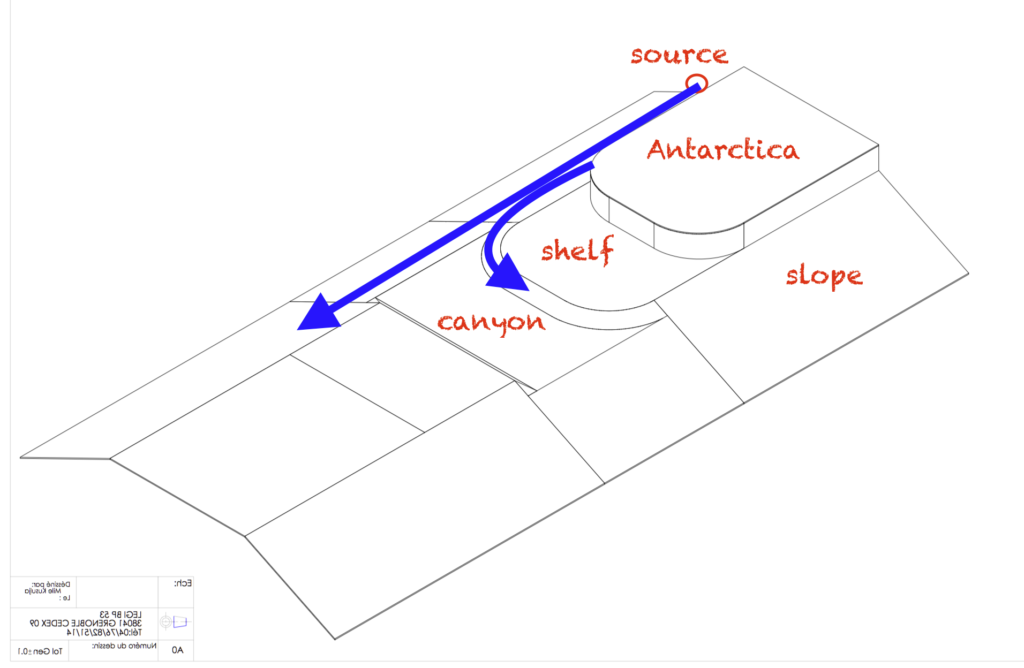
What we are investigating is how a current, introduced at the “source”, will behave. We expect that it will flow along the shelf break and that some of it will turn left and flow around the corner into the canyon, while some of it will continue on straight ahead. How large a portion of the current takes which part depends on several parameters, which we will systematically change over the next couple of weeks: How large the source’s flow rate is (we are starting with 50 liter per minute), whether there is a density difference between the source water and the ambient water (we are starting with no density difference but will later have salt water in the tank and a fresher source) and what happens if we add a sharp corner to the nice and smooth corner of Antarctica and the shelf.
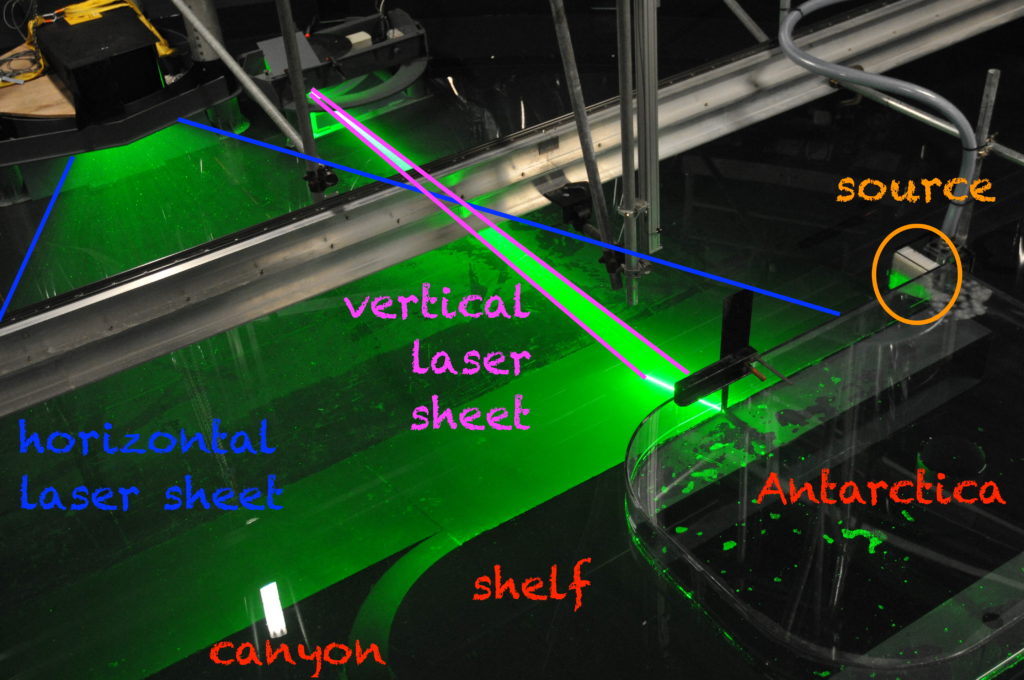
So far, so good. When we look down from the rotating first-floor office, things look a little different (an annotated version further down this page):
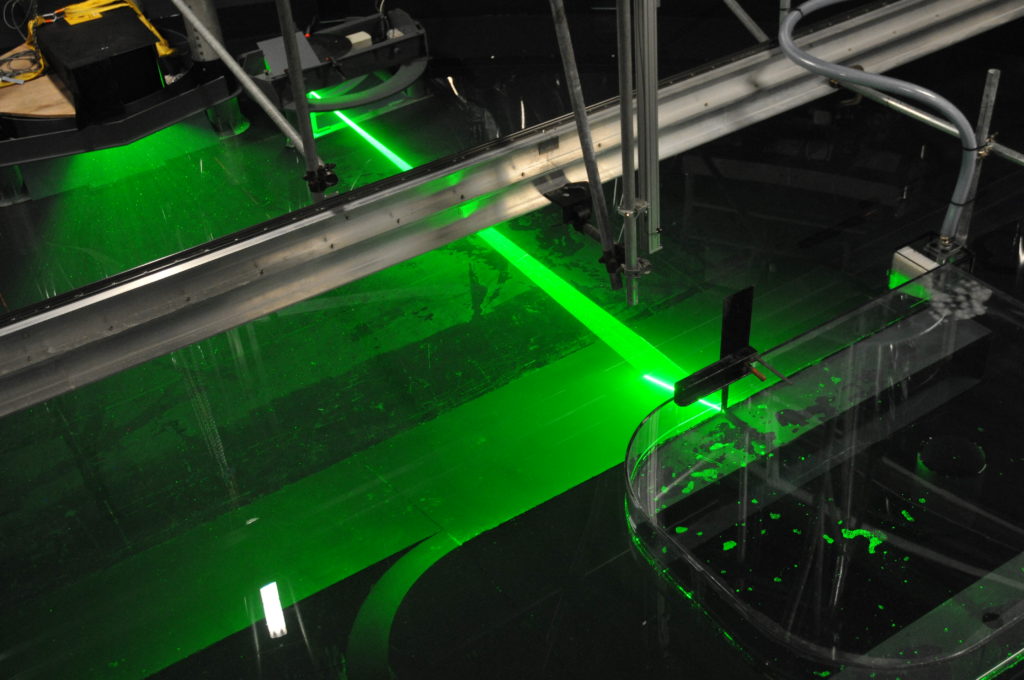
You see (parts of) the topography in the lower right corner of the image. And then you see a lot of green light: Our laser sheets! The laser sheets will illuminate thin layers of water, which we can take pictures of with cameras mounted perpendicularly to the sheets. That in itself isn’t so exciting, but we will have neutrally buoyant particles in the water, which light up when lit with the laser. If we take enough pictures of the particles, we can track individual particles as they get advected by the currents, and thus get a good idea of the flow field that is illuminated by the lasers.
And the cool thing is that we have not only one, but six vertical laser sheets, that are used sequentially. Below you see our first experiment and each picture in the animated gif is showing you a different layer, going from 5 cm below the surface down, so you get an idea of the vertical shape of the flow field. And you see that there is a lot more going on in the layers close to the surface!
Isn’t this amazing? How lucky are we that we got the opportunity to travel to Grenoble to be involved in all of this? 🙂
3 thoughts on “What are we actually trying to measure in our rotating swimming pool?”
Comments are closed.