Closing off our channel at the ice-shelf end to avoid unrealistic outflow

We are very deep into discussing all the different ice shelf experiments that have happened so far. As you see above, the white board in our office is filled with drawings of our interpretations of the experiments.

And as you know, things don’t always go exactly as planned. Or, in fact, most of the time they don’t.

One thing that has been happening in our experiments is that water flowed out of the channel underneath the ice shelf. Not a lot of water, but after long discussions, we decided that — since in reality there is no way for water to come out that end of the channel, because there is land closing off the channel at the end — even a little water was too much and that we needed a way to block off that end of the channel.

However, constructing anything inside a rotating tank full of water and with a lot of scaffolding just above the water level isn’t easy (as I found out when I was sweeping the tank, trying to duck under the scaffolding and flooded the waders I was wearing. Yep, true story…), so even after deciding that we needed a solution, it still took a lot more discussing until we actually had a solution that everybody was happy with.

So now we will build a wall! And it is going to be huge! And it will block all the water so nothing is coming out of the channel any more. And it is going to be the best wall in the world (and maybe Mexico will pay for it? ;-))

Actually, the wall is in the tank already, so now we’ll start investigating whether it actually has an effect or not!

One thing we found out already: Moving a large wall back and forth in a tank creates nice eddies (duh!). But look at how pretty they are! 🙂

And now on to even more realistic ice shelves!

We have already described experiments where our ice shelf was tilted, making the setup a little more realistic* than before (link here). But then later that day, we did two more experiments! And this time, the ice shelf wasn’t just tilted, it was also not going up all the way to the surface (or, well, it’s flat bottom did not, and then there was a sharp edge and the side of the ice shelf went out of the water). So we are expecting to see a mixture between the experiments shown is yesterday’s blog post: Some of the water being blocked by the ice shelf, but some possibly conserving its potential vorticity and going down the v of the canyon and then turning around and coming back up.

And that’s what we saw!

Can you spot the return flow that has come out from below the ice shelf in the lower layers before it gets obscured by all the stuff that got blocked by the ice shelf in the upper layers?

Nice when experiments really work out the way you expect them to do! 🙂

*I have a blogpost in the making on what “realistic” actually means in the context of geophysical fluid dynamics experiments, and if that is even something one should aim for (spoiler alert: not necessarily!), but I keep getting too distracted by all the cool stuff going on here in Grenoble, that it hasn’t progressed out of the draft stage. But I will finish it up and post it, I promise!

What happens when a current meets an obstacle? Topographic steering

As long as water depth and latitude stay the same, a current usually happily goes straight forward. However, a large part of what we are doing at the Coriolis tank in Grenoble has to do with what happens to ocean currents when they meet topography, so sea mounts, ridges or troughs under the water, and what happens then is called topographic steering.

Topographic steering basically means that a current will follow lines of constant potential vorticity (ω+f)/H. In this, ω is the rotation of the fluid (more on this here), f is the Coriolis parameter, and H is the water depth. So if a current is flowing  straight ahead (ω=0) in a sea of constant depth, it will stay at the one latitude where it started. If, however, there is a ridge or a canyon in its way, it will try to move such that it either changes its rotation or that it reaches a different latitude so that it stays on a path of constant (ω+f)/H.

What does that mean for our experiments?

In our experiments, we actually change the water depth not only by sloping the floor down into the canyon, we also change it by taking away height from the top by introducing ice shelves.

f in the tank is constant (explanation here), so only ω/H need to be conserved, meaning that the current needs to either follow lines of constant depth, or compensate for any depth change by changing its rotation. I have described in this post what that means for the flow in our tank: We expect — and observe visually (see picture on top of this post) — that an ice shelf that is tilted such that it is slowly decreasing the water depth will force the current down the slope of the canyon, until it reaches the deepest point, turns, and moves up again.

But now Nadine has plotted the actual measured data, and we see the same thing! Below you see a plot of the flow field on a level just below the upper edge of the canyon. I have drawn in where the ice shelf is situated and where the contours of the channel are, and, most importantly, that the flow field shows exactly the behaviour we were hoping for!


The messy flow field where the contours of the ice shelf are drawn in is probably because the data that is being plotted has been calculated from pictures that were taken from above the tank, through the ice shelf, so we don’t have good data in those spots. But all in all, we are very happy! And almost ready to call it a day. Almost ready, except it is still too exciting to think about our experiments… 😉

What a day in the Coriolis lab looks like

You have seen plenty of images of our experiments over the last weeks (and if you have not, scroll back on the blog!). Time to show you what a day in the Coriolis lab looks like for us!

Above, you see Nadine and Adrian watching experiments. For each experiment, we spend approximately 30 to 40 minutes in the dark, on the rotating platform, lit by the green glow of the laser in the tank and by the occasional emergency exit sign flashing past (as the tank rotates past twice every minute. So if you think Nadine and Adrian look a little green in the face, it might not just be the laser ;-)). During that time, we take a lot of pictures, some of which you saw on the blog already, but we mainly stare into the tank, trying to understand what we are seeing. Nadine takes a lot of notes about all kinds of things: When the experiment started, at what time it transitioned into new phases, what settings were used, if there were problems or special occurrences like for example a lot of bubbles coming from the source. And we are continuously discussing our observations and how we interpret them, because depending on how well we think an experiment worked, we will have to make decisions on how exactly the next one will be done. And it is quite stressful to rely on our observations alone without having processed and analysed the actual data! But that part of the research will still take years to complete, so we can’t wait for that right now.

Here is a time lapse over two experiments and the setup periods in between (and hang on for a second if they don’t start playing right away, they will eventually). And don’t forget: We are on the rotating platform for the whole time!

When we are not running experiments, or if there are longer breaks between experiments because the water in the tank needs to settle into solid body rotation, we work in the office you see below. I wanted to make a time lapse of us working in there, too, but then we decided to just have lunch instead, so you only see a very short one and then we leave. First things first! 🙂

It’s just a normal office and we work on our computers in very much the same way we would in any other office in any other place. Except that we only need to walk a couple dozen steps to be back on the rotating platform, and that is still very exciting 🙂

Tilting the ice shelf! Or: Our experiments are getting more realistic

Until now, we have used an “ice shelf” (a plastic box) which had a horizontal bottom (Read more about the general setup of the experiment in Nadine’s post). The bottom of the ice shelf was either right at the water’s surface, or lowered down into the water. What we see then is shown in the gif below, where we are scanning the full water depth from the bottom upward. The ice shelf is resting on the upper edge of the v-shaped channel, so it effectively blocks the flow, which separates at the ice edge and turns mainly left.

Now it’s time to get used to a new vantage point, which lets us look underneath the ice shelf. The source isn’t in the upper right-hand corner any more as it has been in all images and movies on this blog until now. See the sketch below: The source is in the upper right-hand corner and the ice shelf sits in the lower center of the picture, across the v-part of the channel.

The gif below shows the same experiment that we saw before, only this time from a similar perspective as shown in the sketch above: When the flow reaches the ice edge, it is blocked and turns to the side.

But then today, we have started tilting the ice shelf (well, Adrian and Thomas have, as you see in the image on top of this post, but I will keep saying “we”).

This might be more realistic — an ice shelf would probably have melted more the further out into the ocean you look (where the ice would have been exposed to melt longer and also the currents flowing under the ice shelf would still be warmer), and therefore we would expect the base of the ice shelf to slope up the further towards the open ocean you go. But this circulation is also one that is easier to understand theoretically: We are expecting the current to stay on lines of constant potential vorticity*. But it can only do that if those lines exist. In the previous experiments, there is a jump in potential vorticity introduced by the edge of the ice shelf, since the water depth decreases drastically as the current meets the ice shelf. Therefore there is no obvious way for the current to take since it can’t conserve its vorticity no matter where it goes (which is why we saw most of it just bouncing off the ice edge and flowing away to the sides). Now, we were hoping to see a circulation where the current, reaching the ice edge while it is flowing approximately half way down the slope, would be guided down the slope as the ice comes further and further down into the water, until at some point it crosses the deepest point of the slope, and turns backward, flowing up the slope and towards areas where the ice isn’t reaching as far down. That way, the water depth the current feels would always stay the same, since it is moving up and down the slope to compensate for the change in height introduced by the ice shelf.

So here is a gif of an experiment where the ice shelf is tilted such that its edge on the source-side is at water level, while the opposite edge rests on the edges of the canyon.

In case you can’t spot it, here is a sketch of the circulation:

So what I described above is actually exactly what we observed! Very very exciting! 🙂

*For a quick explanation of vorticity see this blog post — quick and dirty explanation is that if water depth changes, a water column will change its rotation. Either by moving to a place with a different planetary rotation (but it can’t do that in our tank, see here), or by starting to rotate itself and hence changing direction

What would you like to know about our experiments with a 13-m-diameter swimming pool on a merry-go-round?

On Wednesday, October 18th, we are going to answer every question we’ve been asked until then and on that day.

What would you like to know? Leave a comment here on the blog, or on Facebook, or on reddit, or on our #OceanAMA. Or email us, tweet, just get in touch! Ask us anything, we are looking forward to hearing from you! 🙂

And do you know someone who would just love the chance to ask us anything? Then please share this post with them!

Investigating ocean currents in a rotating swimming pool

Reposting from Sci/Why “where Canadian children’s writers discuss science, words, and the eternal question – why?”, where we got to feature our experiments a couple of days ago:

Have you ever wondered what happens when you put a 13-m-diameter swimming pool on a merry-go-round? Probably not. But I am here to tell you today about what happens when you do just that, and what you can learn from doing so.

I am part of an international group of scientists, doing research on currents in the ocean (and you can read more about who we are and what you do on our blog: https://elindarelius.no). Specifically, we are interested in how warm water is transported towards an Antarctic ice shelf. As you can imagine, Antarctica is not the easiest place to travel to and measure the ocean, especially not during winter. There are some observations of warm water reaching the ice shelf and contributing to melting the ice, but it is not known yet under what conditions this happens.

Why a pool?
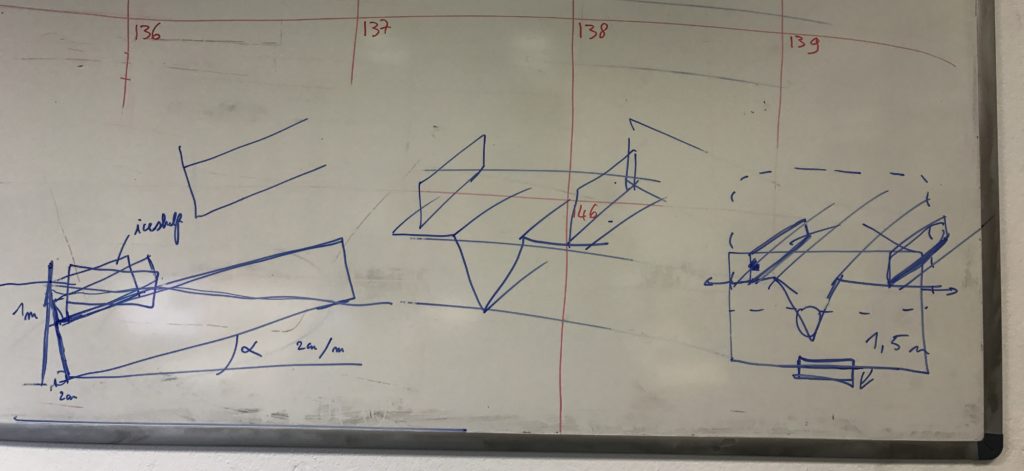
In order to understand how water behaves in the ocean, we are reproducing real-world features that we suspect have an important influence on the current’s behavior, but in miniature, and inside our water-filled tank. Then we can modify those features and observe which parts of them actually determine how the water flows, and which parts are not as important. In our case, we are changing the miniature coastline of Antarctica to see what makes the current turn and flow into a canyon instead of just going straight ahead.

Why rotation?
We need to rotate the tank to represent the Earth’s rotation. This is because the Earth’s rotation influences all large-scale movements on Earth, including ocean currents: Moving objects get deflected to their left on the Southern Hemisphere. Below is a short video of the rotating, empty tank, to show you what happens when you roll a ball in the rotating tank: It does not go straight ahead but just curves to the side!

[vimeo 233272527]

Before Nadine, the scientist shown in the video, climbed into the tank, you saw her walking alongside it. Even though the tank was turning very slowly (only one rotation per 50 seconds), she had to walk quite fast to keep up! This is how fast we need to spin the tank in order to have it rotate at the right speed for the size of our Antarctica.

How does it all work?
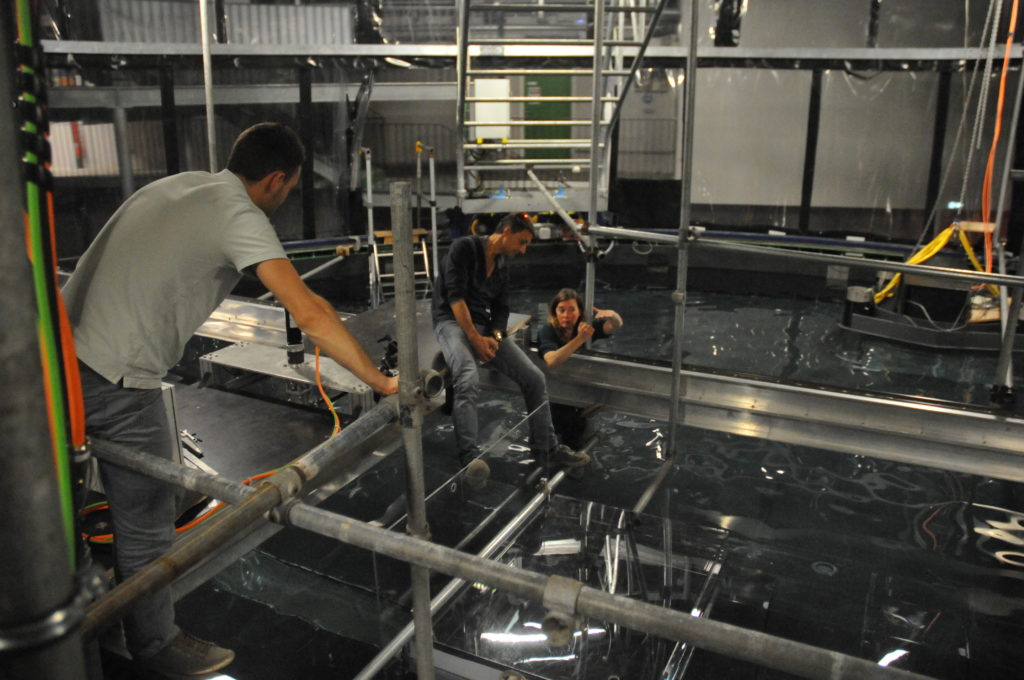
There is only one tank of this size — 13 meter diameter! — in the world, and it is situated in Grenoble, France. Researchers from all over the world travel to France to do their experiments in this tank for a couple of weeks each. In the gif below, you see the tank rotating: First, you see an office moving past you (yes, there are several floors above the water, including the first one with an office, computers, desks, chairs and all! That’s where we are during experiments, rotating with the tank) and then you can see the water below, lit in bright green.

There is a huge amount of effort and money going into running research facilities like this, and everybody working with the tank needs to be highly specialized in their training.

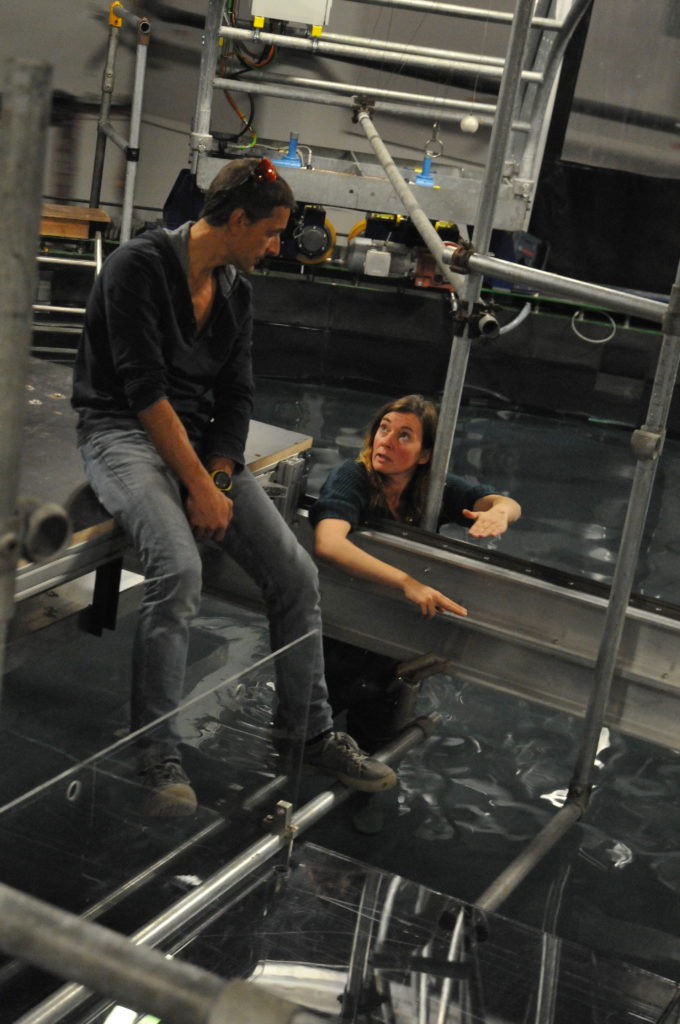
What do experiments look like?
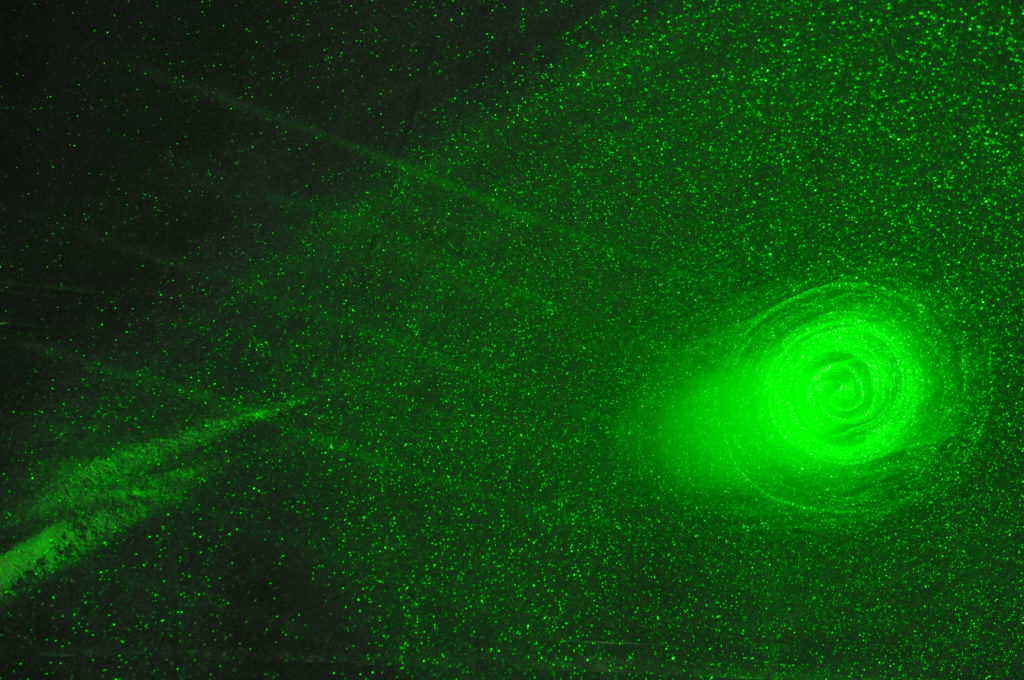
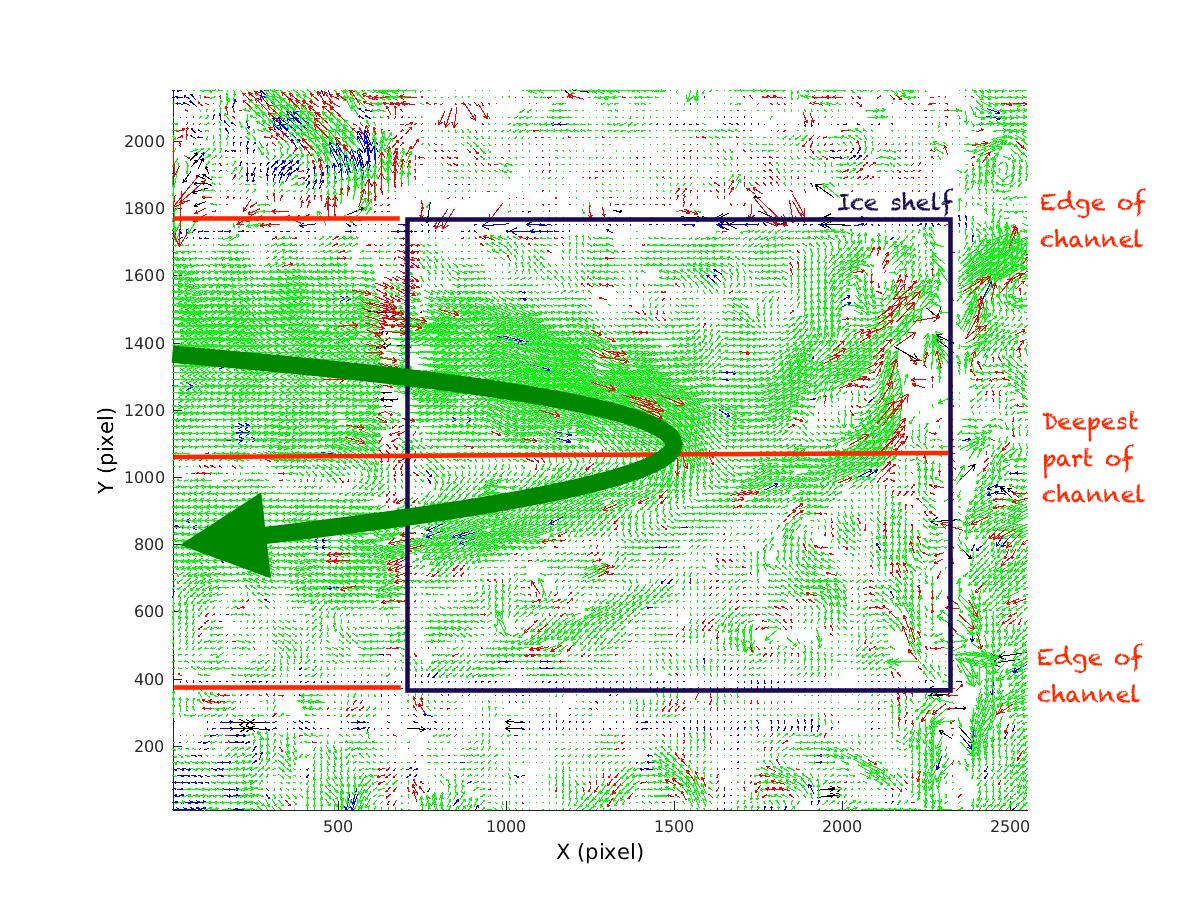
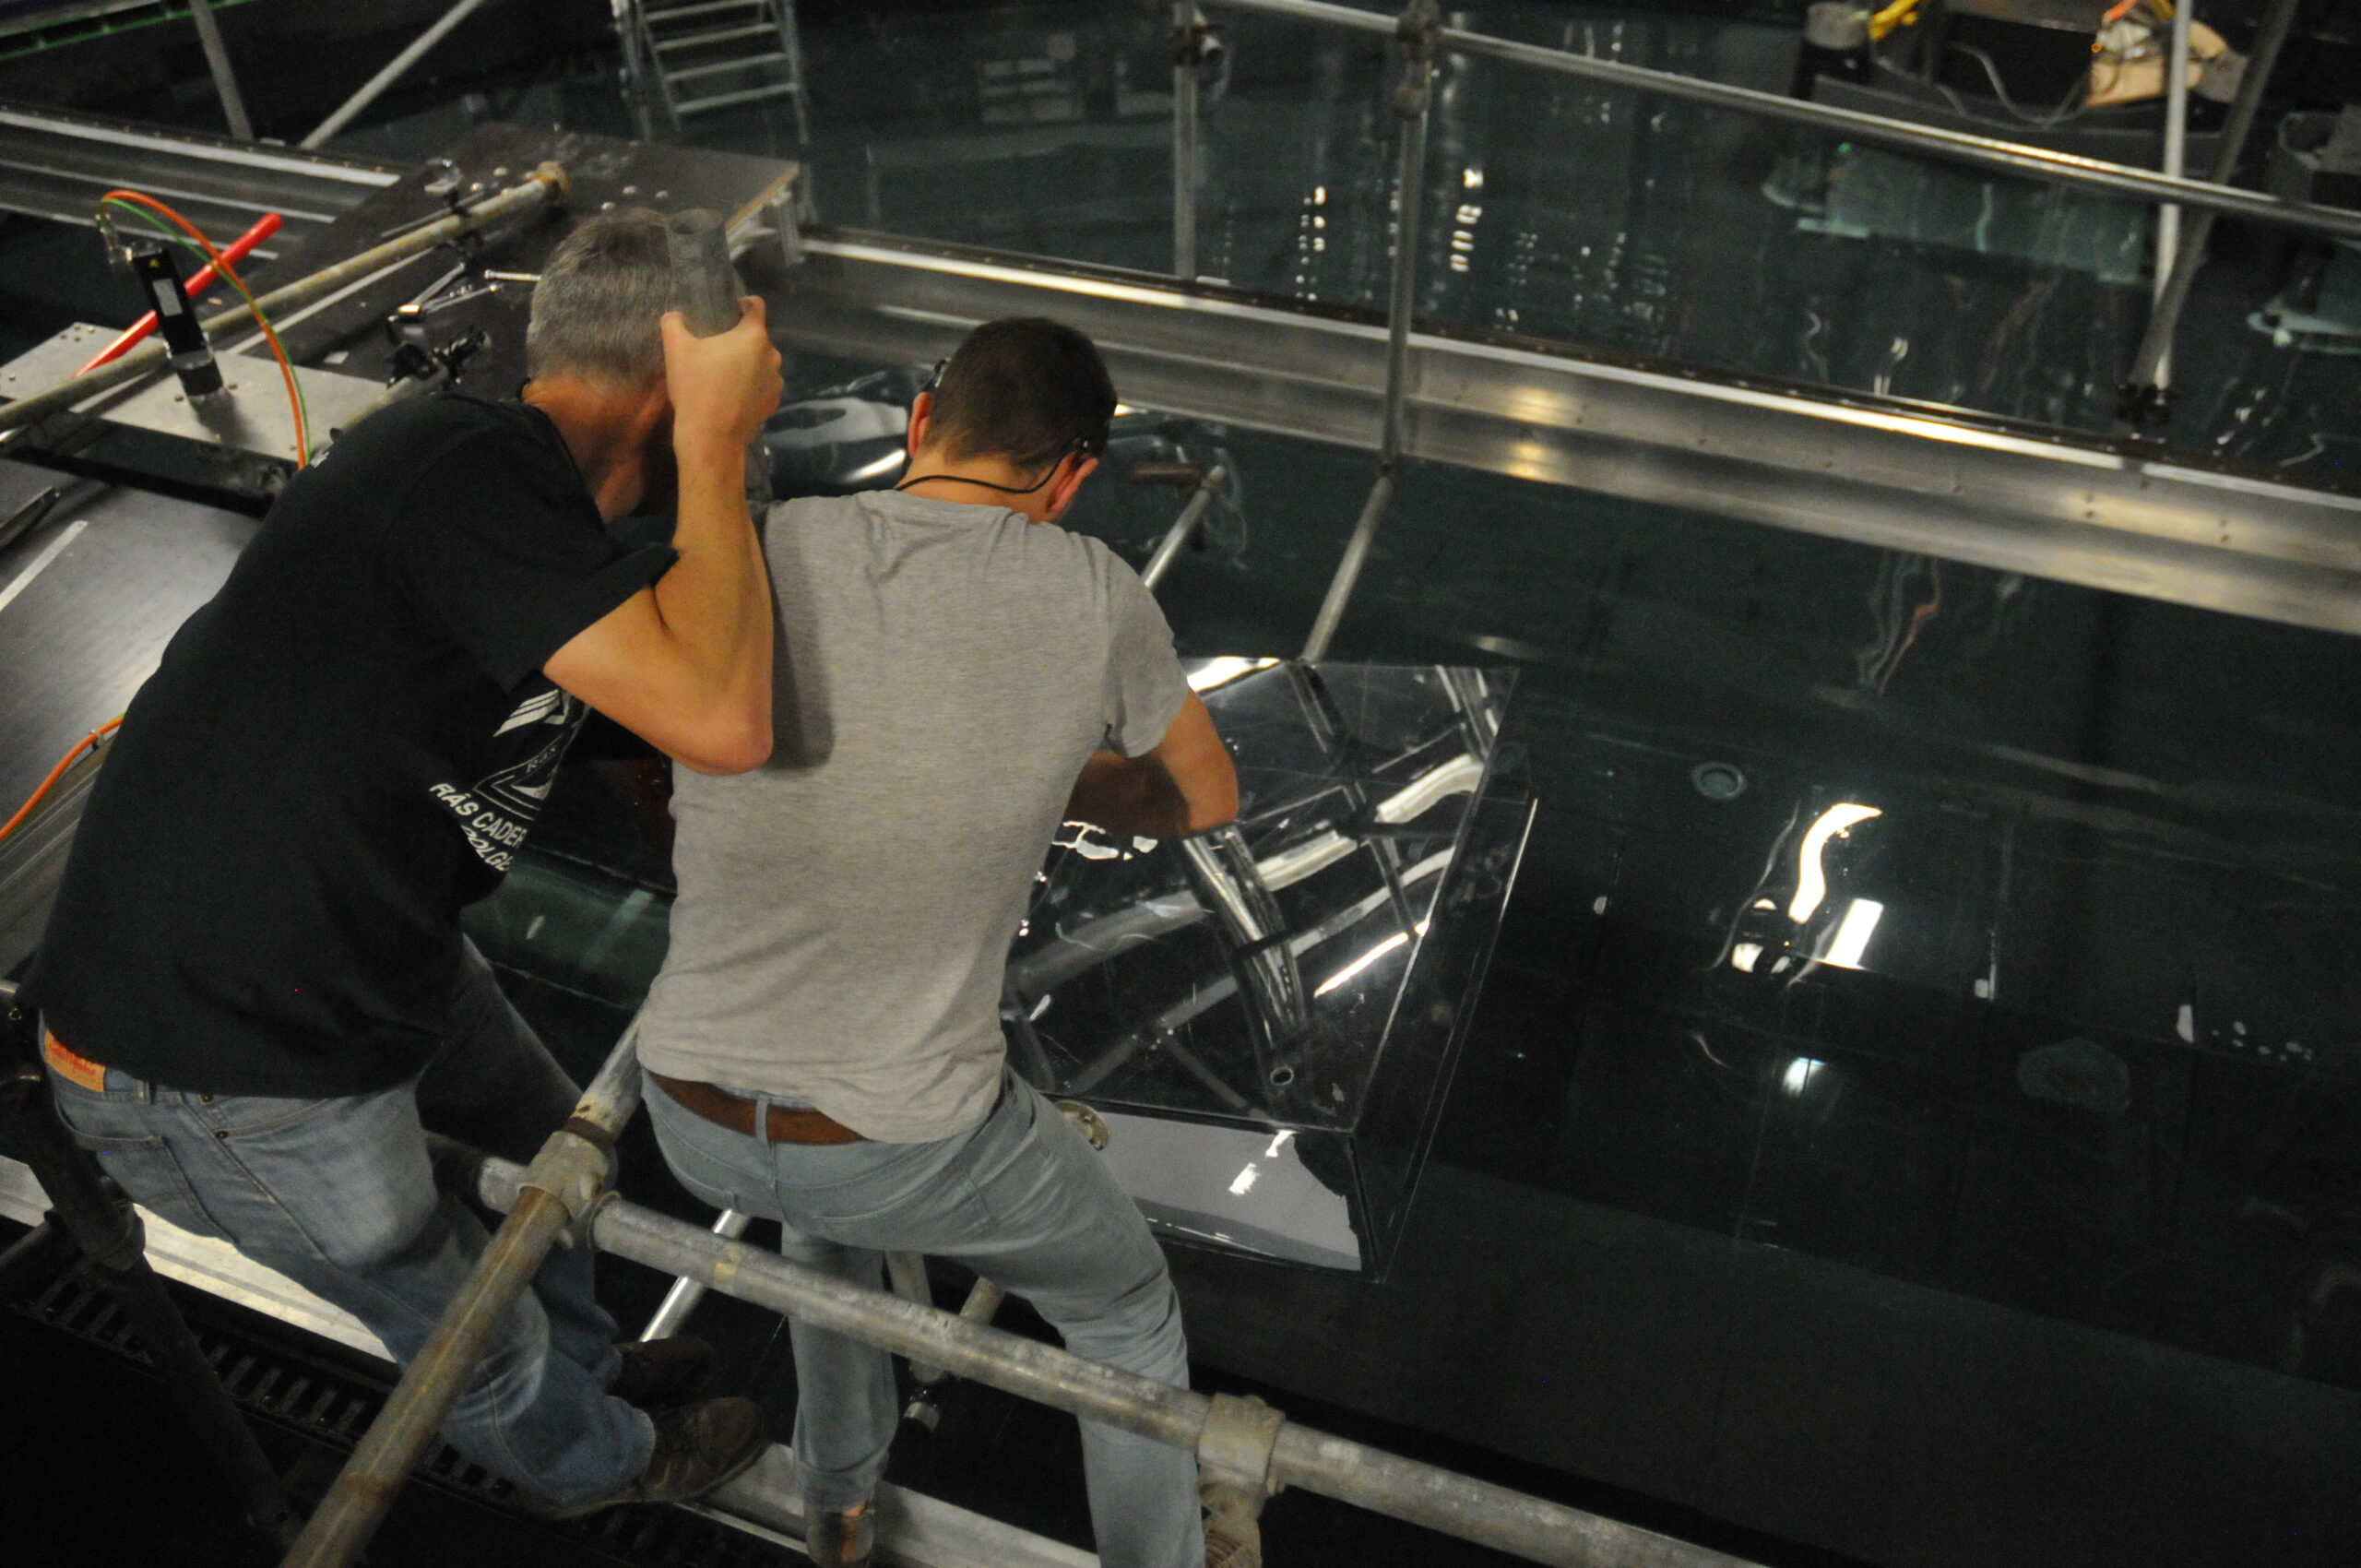
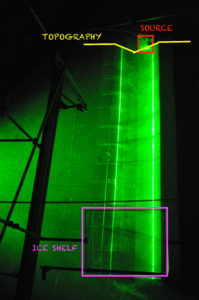
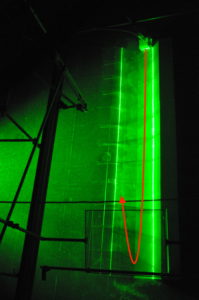
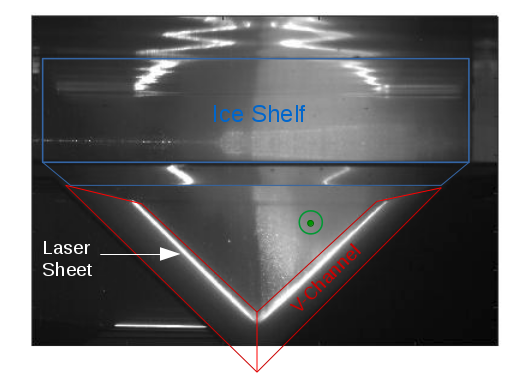
When there is water in the tank, we need some special tricks to show how the water is actually moving inside the tank. This is done by seeding particles, tiny plastic beads, into the water and lighting them with a laser. Then special cameras take pictures of the particles and using complicated calculations, we can figure out exactly how the currents are moving. Below, you see a gif of one of our experiments: The current starts coming in from the right side of the image, flowing along our model Antarctica, and then some of it turns into the canyon, while most of it just goes straight ahead.

Depending on the shape of our Antarctica, sometimes all the water turns into the canyon, or sometimes all of it goes straight ahead.

What have we learned?
That’s a difficult question! We are still in the middle of doing our experiments, and the tricky part with research is that doing the experiments (even though that can be a huge undertaking as you see when you look at what a huge structure our tank is, or what enormous effort it requires to go to Antarctica with a research ship) is only a tiny step in the whole process. Nadine, who you saw in the movie above, is one of several people who will work on the data we are currently gathering for the next four years! But even though we are not finished with our research, there are definitely things we have learned. For example, the length of Antarctica’s coast line that the current flows along before the canyon interrupts its flow is very important: The shorter it is, the larger the part of the current that turns into the canyon. How all our individual observations will fit together in a larger picture, however, will still take months and years of work to figure out.

Where can I learn more about this?
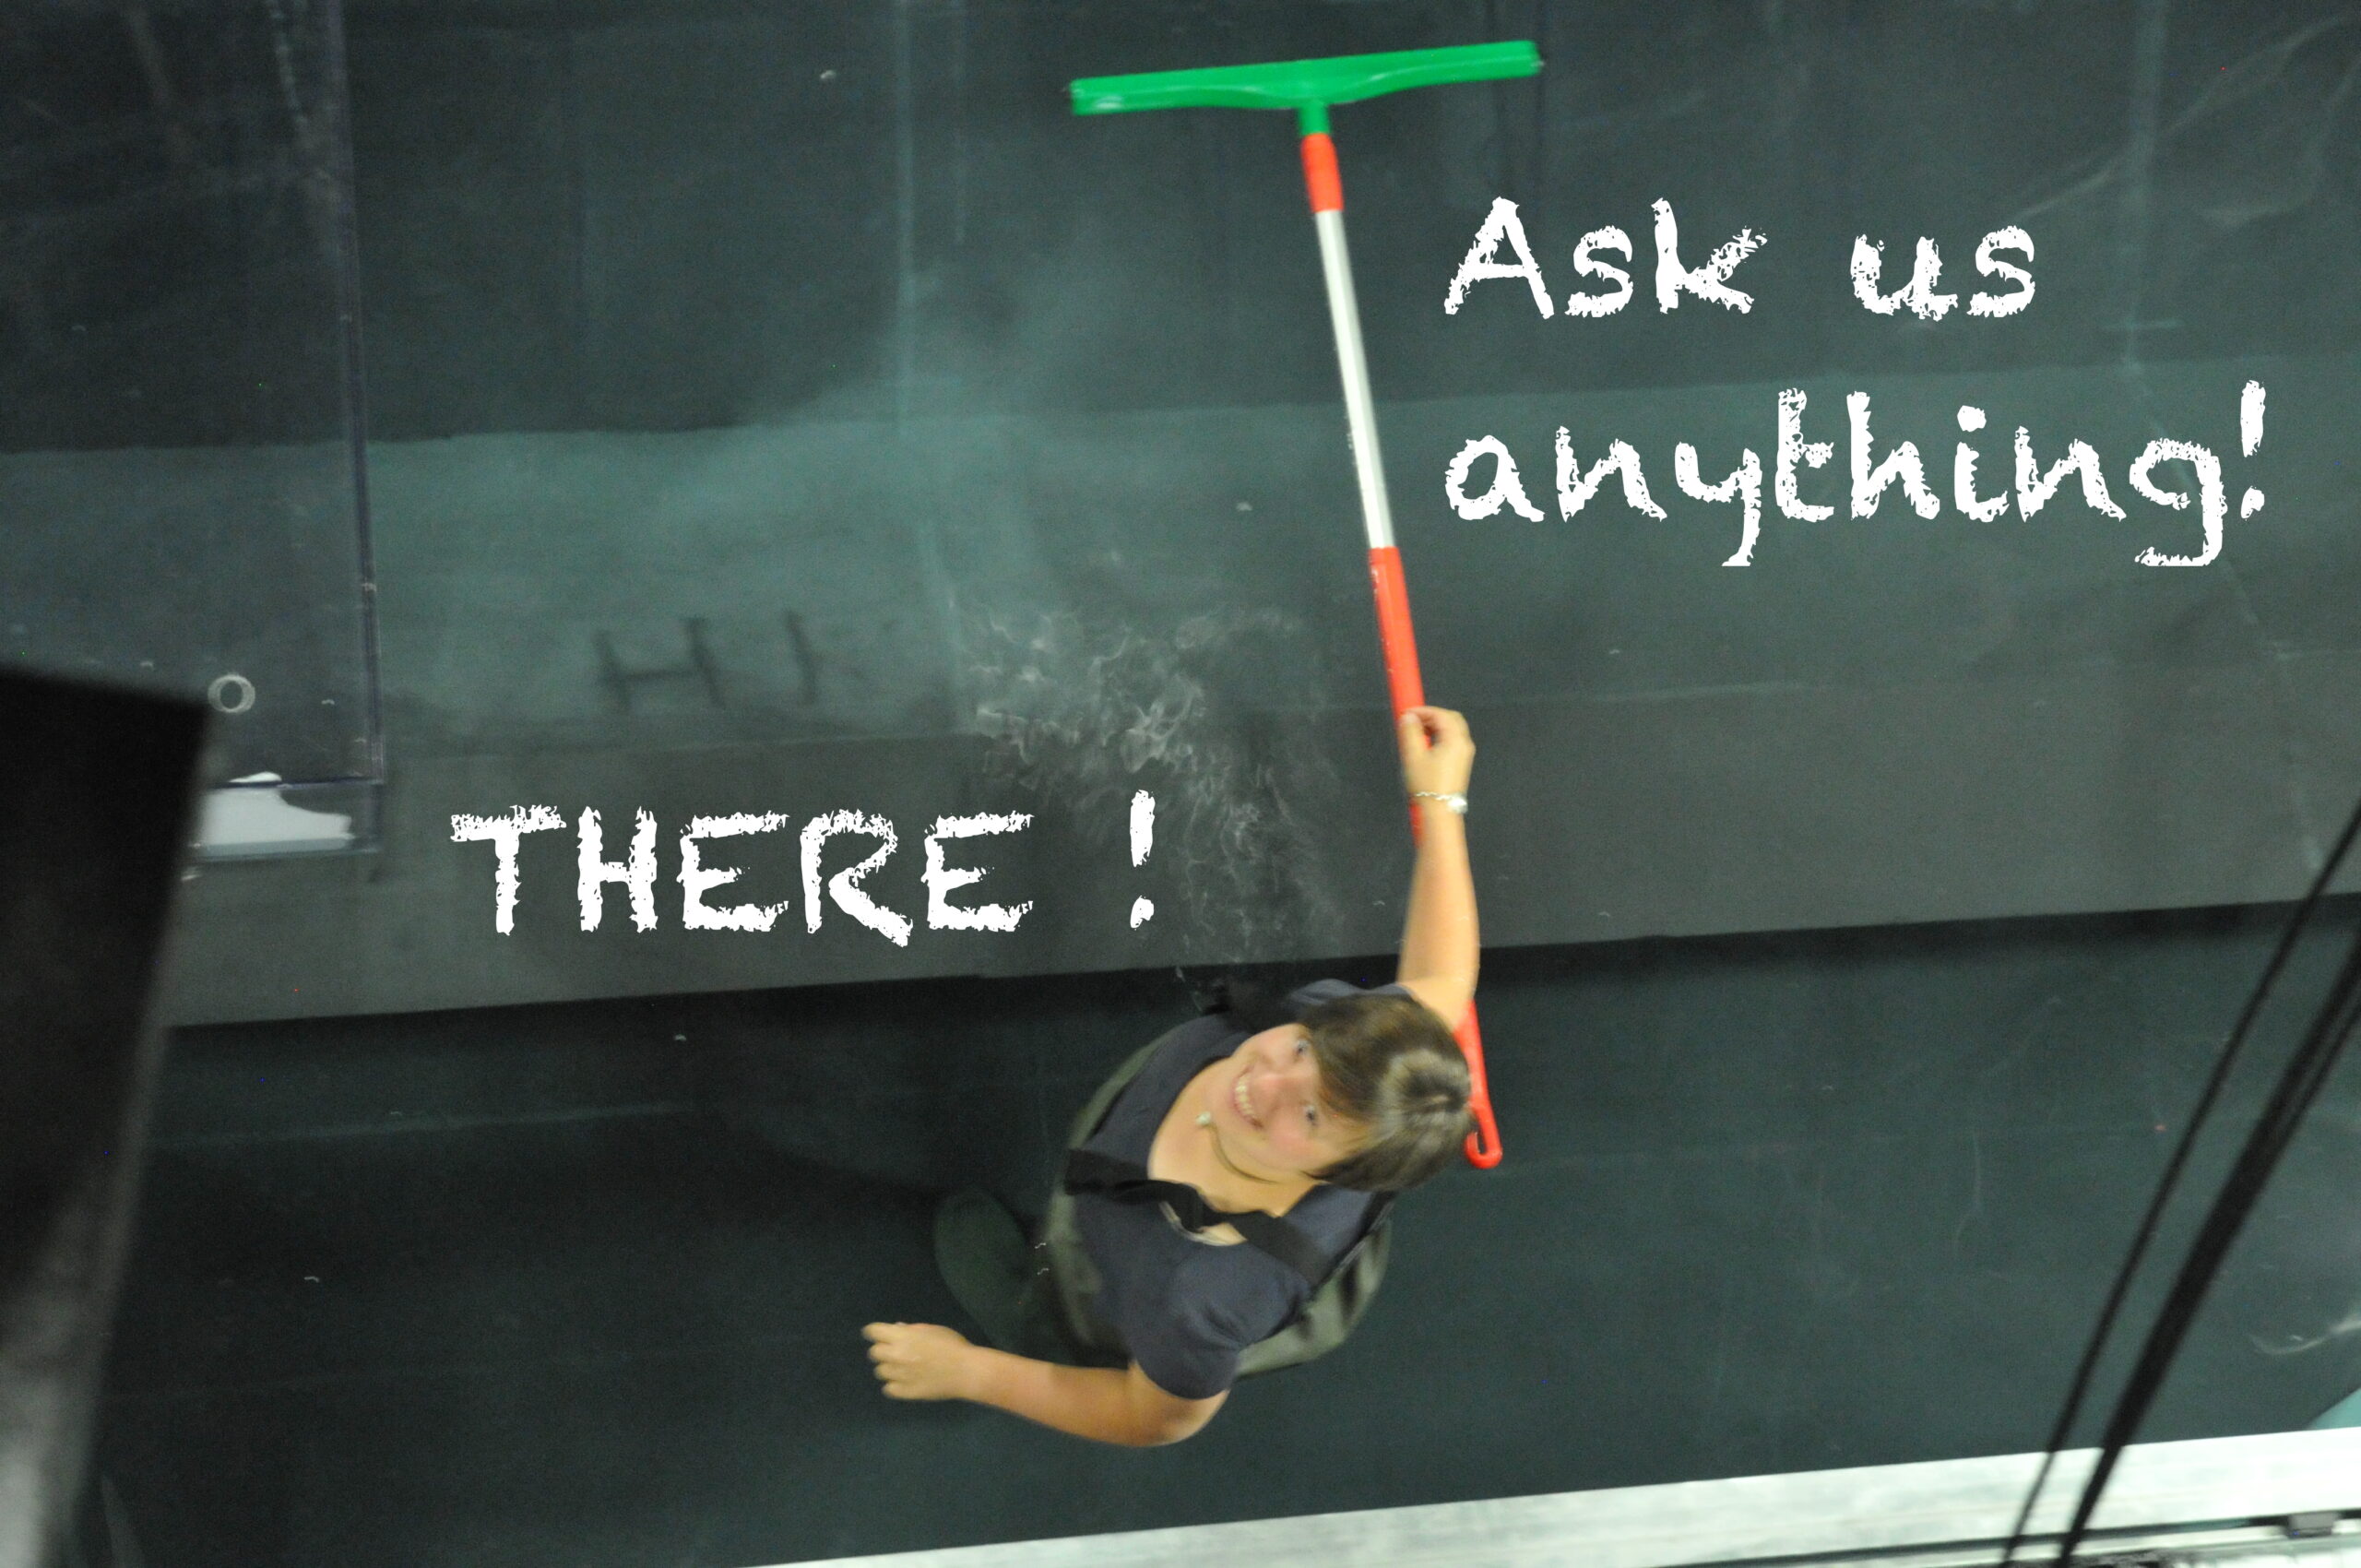
If you have any questions, we would love to hear from you! We are hosting an “Ask Me Anything” event on October 18th (link here: https://oceanama.com/hi-i-am-mirjam-we-are-investigating-ocean-currents-in-a-13-m-diameter-455228/ but you can also leave questions on our Facebook page: https://www.facebook.com/EDareliusAndTeam/ or directly on our blog: https://elindarelius.no)

Introducing: Tae-Wan Kim

Written by Tae-Wan Kim

My name is Tae-Wan Kim and I’m a senior research scientist at the Korea Polar Research Institude, where I’m in charge of physical oceanography in Southern Ocean. My research interests center on (1) the ocean circulation in continental shelf of Antarctic coastal region and (2) heat and mass balance between ocean and ice shelves. I joined my institute in 2011 and participated 8 times Antarctic and Arctic surveies. In Amundsen Sea of West Antarctic, my field programme involved the measurement of hydrography and ocean circulation using the shipboard CTD, ADCP and long-term ocean moorings. Espacially, I measured ocean current, temperature and salinity more than 2 years in front of Ice Shelf. From this data, we can identify the variability of ocean circulation and heat and mass balance between ocean and ice shelf. When I am in Grenoble, I want to improve my understanding on the ocean circulation process in continental shelf. This experiments using the coriolis platform will give a good chance for me!

First impression of the ice shelf experiments

This week we have started new experiments that use a V-shaped channel sloping down towards an ice shelf front. More than a whole week was used to remove the topography for the shelf break experiments and to build up a new topography, readjust the cameras and set up the lasers.

After some days of experiments, you will finally get to see some first time lapse videos of the current flowing towards the ice shelf! In these experiments, we want to find out how the current behaves as it reaches the ice shelf front. How much of the water gets blocked as it reaches the ice front that corresponds to a large step in water thickness? Does the water manage to flow underneath the ice shelf? In which direction does it go when it gets blocked? And what is happening inside the ice shelf cavity? As in the previous experiments, we are using a barotropic current (no density difference between the inflowing and the ambient water) and compare it to a baroclinic current (denser inflowing water than the ambient water).

With our GoPro that is installed high the topography in the center of the tank, we can record the current inside the channel. In this case, a barotropic current flows towards an ice shelf that is lowered 30 cm beneath the surface and sits on the wings of the V-shaped channel.

One of the cameras is installed on the left side of the above gif about 10m behind the ice shelf. It looks into the channel facing the source. With this camera, we are able to observe if the current is barotropic or not.

With the vertical laser sheet, we can see the cross section through the channel. The cloud of particles shows the location of the current, coming towards the camera. The transition between the current and the ambient water is very vertical, which shows that the flow is barotropic.

You may think that it sounds very easy to produce a barotropic flow – we just need to use the same water for the inflow as for the water inside the tank. But in reality it turns out that the current is very sensitive to small density differences and the inflowing water easily gets buoyant as it is stored under the roof of the rotating platform! However, a higher rotation speed seems to reduce the sensitivity to the density difference!

Introducing: Adrian Jenkins

My name is Adrian and I’m a senior research scientist at the British Antarctic Survey, where I study the interactions between the ice sheet and the ocean that surrounds it.  The particular focus of my research are the physical processes that control the rate at which the ice melts into the ocean waters and the impact that has on both the ice sheet and the ocean.

I joined BAS in 1985 as a glaciologist with a background in physics and geophysics and initially undertook three seasons of fieldwork on Ronne Ice Shelf, a vast body of floating ice covering an area equal to that of France.  My field programme involved a long over-ice traverse, starting 800 km from the coast, where the 2-km-thick ice first goes afloat, and finishing at the front of the ice shelf, where the now 200-m-thick ice breaks off to form icebergs.  The thinning of the ice during its progress toward the calving front results from a combination of ice flow, as it spreads out over the surface of the ocean (much like a drop of oil would, only very much slower), and melting from the ice shelf base, where it is in contact with the underlying seawater.  Using a series of glaciological measurements that I made at regular intervals along the traverse, I estimated the rates of melting and freezing that must be occurring at the ice shelf base, then developed a simple numerical model of the ocean circulation beneath the ice shelf to explain those results. The problem of ice‐ocean interactions has remained the primary focus of my research efforts throughout my career.

In recent years I have been mainly concerned with the study of how ocean-driven melting of the much smaller ice shelves of the south-east Pacific sector of West Antarctica is controlling the rate at which ice is being lost from that part of the ice sheet.  The resulting thinning of inland ice there currently represents Antarctica’s main contribution to sea level rise, so understanding the processes that drive it is crucial for making reliable estimates of how much further sea levels will rise in the future.  I’ve used numerical models of the ocean and sent Autonomous Submarines beneath the ice to study the ocean circulation that carries warm water to the ice and takes meltwater away.  These studies point to the need to understand better the complexities of the ocean circulation near the front of the ice shelf.  The currents that cross the ice front determine how much heat is available to melt ice from the ice shelf base, but are difficult to observe.  That’s why I’m interested in these laboratory experiments.  With the geometry of the tank, its rotation rate, and the forcing on the circulation precisely known, we can begin to understand the fundamental controls on the cross-ice-front circulation.