#BergenWaveWatching: observing the tides from a bus

Kjersti, Steffi, Elin and myself (Mirjam) recently discussed ways to better integrate the GEOF105 student cruise into the course. My suggestion was to ask the students to observe things throughout the whole duration of the course, and then have them relate their time series with what they observe when “at sea”. In this mini series tagged #BergenWaveWatching, I write up a couple of suggestions I have for observations that are easy and fun to make. I am anticipating that my suggestions will be strongly biased towards #wavewatching, so if you have any other suggestions, I am all ears! 🙂

My first recommendation in this series is actually more about watching tides than watching waves, but it is impressive and well worth a visit!

Where to go

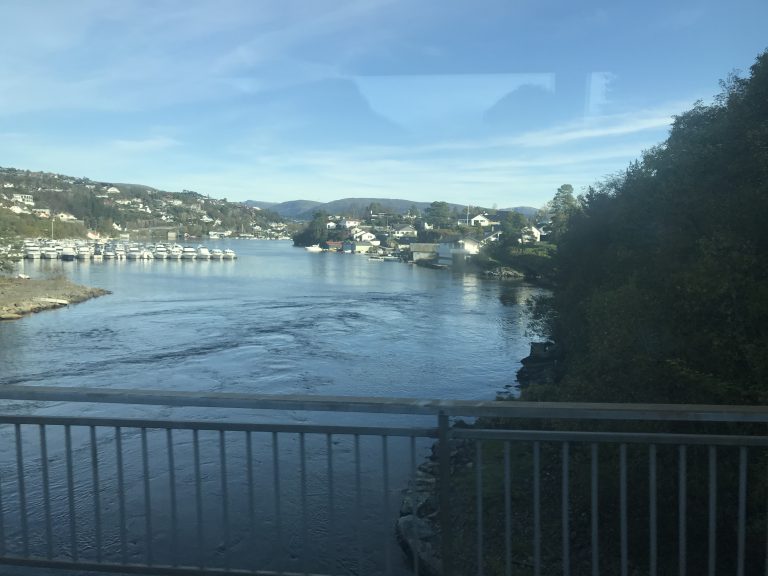
Straume Bru — either get off the bus 51 at that bus stop and walk around (as I did for this blog post), or, if you have to take that bus regularly anyway, just observe from the bus.

Observing the tidal current at Straume Bru from the bus

When to go

If you are going for a one-off visit, you might be well-advised to look at the tidal forecast and time your visit so you are there a little later than half time between high water and low water (or, I am assuming, low water and high water), so you will be able to observe strong tidal currents. As the currents change direction when the tide turns, there will also be periods with no current or very weak current, which are probably not nearly as impressive. Ideally I would want to spend a full tidal cycle there, but I haven’t gotten around to doing that yet. Maybe you will?

If you only pass the current on the bus, then you will hopefully do it often and take many pictures!

What to look out for

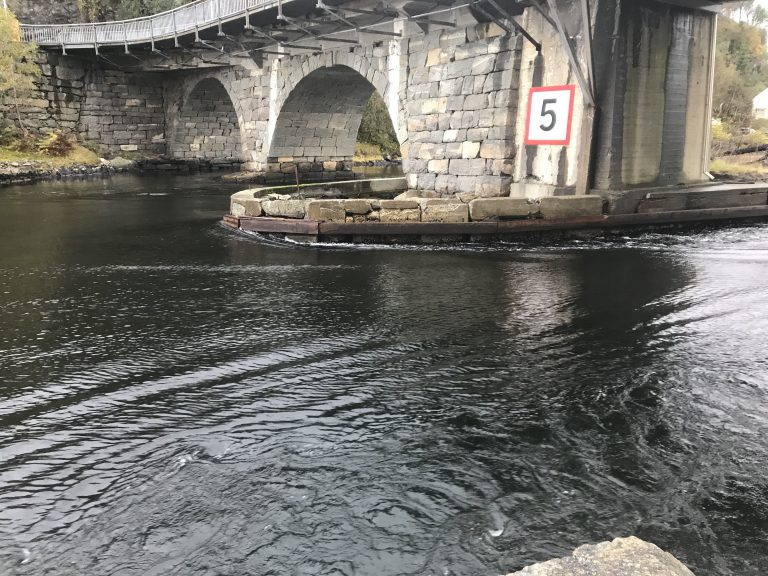
If you are at Straume Bru at the right time, you will be able to see a strong current going underneath the bridge. You might want to take pictures of the current that also include features of either the bridge or other structures or landmarks, so you can relate this and further pictures you might take to each other. What’s the water level like? How strong is the current? Which direction is it going in?

A picture of the tidal current at Straume Bru, including the bridge itself for scale and reference

What to do with the data

By “data”, I mean the collection of pictures on your smartphone. You could, for example, relate them (thanks to the phone’s time stamp on the pictures) to time before/after high water as I did in this post for tides on the Elbe river in Germany. This of course doesn’t account for the spring/neap signal, which you might want to include.

Questions that I find interesting: When is the strongest current actually happening relative to high water, and within the spring/neap cycle? In what way do ingoing and outgoing currents differ (and why? Shape of the landscape? Different gradients in the water level? …)?

How this is relevant for the student cruise

One task on the GEOF105 student cruise is relating trajectories of drifters to several factors. The wind field on that day, for example, but also the tidal currents in Byfjorden. Even though the drifters will be deployed in a different area, having a good intuitive understanding of tides makes interpreting the drifters’ trajectories a lot easier.

Do you have suggestions for us? What other spots or topics would you recommend in and around Bergen to be added to the #BergenWaveWatching list? Please leave a comment! We are always looking to expand this list!

Do you like Classical Music & the ocean ?

… and happen to be in Bergen 12 or 13 December, 2019? Then you shouldn’t miss out on the concert in Grieg Hallen where the Bergen philharmonic orchestra and researchers from University of Bergen joins up on the stage to take us on a cultural&scientific journey to the the depths of the oceans! You can read more about the concert series here (in Norwegian only).

On Friday I’ll be in the entrance during the pause together with a couple of “Nansen water catchers” and Snotra, one of UiB’s amazing gliders – see you there!


Seaglider deployment in the Iceland Sea. Photo: K. Våge


Congratulations Vår Dundas, MS!

Today Vår Dundas, MS successfully presented her Master’s Thesis “Oceanic heat transport towards the Getz Ice Shelf, Amundsen Sea”!She has been working with data from a mooring that we deployed in a trough leading up one of the iceshelf fronts of Getz ice shelf, just east of Siple Mountain in the Amundsen Sea.When we deployed the mooring back in 2016, we referred to it as the “boring mooring”-but Vår did a good job proving that it did not desrve that name! Thank you Vår for a very  nice presentation and all the hard work you’ve put into your thesis! Now you deserve a long and relaxing Christmas holiday, and then we’ll see what happens next!

Sensors Knut Barthel and Jenny Ullgren questioning Vår about her work.
Champagne (and Muffins) afterwards!

#BergenWaveWatching: Introducing a new series of blog posts

Kjersti, Steffi, Elin and myself (Mirjam) recently discussed ways to better integrate the GEOF105 student cruise into the course. Right now,  even though students write a report about their work on the student cruise, it’s pretty much a one-off event with little connection to what happens before and after, which is a pity. Having a whole research ship for a whole day for a group of 6-8 students (or possibly 10 next year) is such an amazing opportunity! We want to help students make the most of it by attempting to foster a curious mindset before they board the ship.

One idea is to ask the students to observe things throughout the whole duration of the semester, and then have them relate their own “time series” of those observations with what they observe on the student cruise. Ideally, students will be observing their chosen topic for a couple of weeks before the cruise, then go on the cruise looking at everything there with a focus on that topic, and then continue to observe it in their daily lives after the cruise. But even if it’s not connected to the student cruise or this specific class, I think giving students the task to make regular observations over the course of a whole semester would be a really good way to connect their studies better with their regular lives outside of university.

Do I have ideas of what the topics could be? Of course! And I have scheduled posts over the next two months, in which my ideas will be presented one by one. But today, I want to talk about what I think what purpose this assignment would serve.

The goal is not to collect data that will advance science or to work on original research questions. It is rather to help students get into the practice of focussing on details in the world around them that might otherwise go unnoticed. To collect observations using only minimal resources (like for example stopping on their commute for seconds only, taking pictures with their smartphones, using the readily available weather forecast for context). To try and explain pattern they observe using their theoretical background from university. I want to help students get into the habit of actively observing what is going on around them, to become fascinated with discovering things related to their studies in their everyday lives.

I myself, for example, am absolutely fascinated with waves, and I notice them anywhere (read more about that on my blog, if you are interested). On the most recent GEOF105 student cruise, there was a bucket that was used to bring seawater up on the deck for salinity to be measured. And what jumped out on me? The standing waves in that bucket! You see them in the picture below, but what struck me was that most people really didn’t seem to notice what was going on there, and how FASCINATING it was. Someone even commented to the effect that they would have never noticed the waves in the bucket if I hadn’t pointed them out to them, even though they were sticking probes right into the waves. And while I spent the better part of two days moving the bucket around to see all the different wave pattern that occurred on different spots on deck, most other people didn’t even seem curious to find out why myself and a handful of other people were staring into a blue plastic bucket. And that makes me sad. Does everybody need to find waves fascinating? Of course not. But should students at least be a little curious about science topics that clearly fascinate their instructors? Yes, I believe so.

More about the cool waves in the blue bucket in this blog post!

So my mission with this series of blog posts is to give examples of where you can easily observe oceanography-related phenomena in and around Bergen, hoping that you might start looking at those spots with different eyes. And maybe you will find a specific topic that you become fascinated with. Because once you start focussing on something that seems random and rare, the very thing seems to appear everywhere in your daily life. Like for example hydraulic jumps. As shown in the picture below — once you start focussing on those, you see them appear everywhere as if out of thin air.

Hydraulic jumps. Picture from this blog post

This kind of curiosity around physics phenomena is — in my opinion — absolutely desirable, especially in students. It makes dry theory or seemingly obscure topics become more relevant. As you start noticing phenomena, you also start noticing more about them, for example understanding the conditions under which the appear. And you also start anticipating where they might occur, so you will look to see whether your prediction is correct. It’s a vicious circle, but one that I would encourage you — and especially students — to enter. To me, it’s part of my identity as a scientist — to use my initial understanding of processes to continuously want to learn more and more about them.

Wave watching has definitely become a part of my life that I don’t want to miss. What will you start seeing everywhere? Or what is it that you are maybe already seeing everywhere that most people don’t? I am anticipating that my suggestions in this #BergenWaveWatching series will be strongly biased towards #wavewatching, so if you have any other suggestions (maybe even with pictures already?), I would love to hear about them! 🙂

Today is Antarctica day!

Nadine just made me aware of this book on the Antarctic treaty  – written (by  J. H. Berkman & A. Pope) for children and illustrated by children from all over the world! It is available in different languages: Swedish, Norwegian, English, French, Spanish, Arabic, Japanese … and many more! Isn’t that the perfect way to celebrate Antarctica day?

You can download the pdf (or order a paper copy) here

Happy Antarctica day!

A Taylor column experiment that is kinda working

When I was visiting Elin a couple of weeks ago, I was hoping to set up an impressive Taylor column experiment. Maybe my expectations were too high of what is possible to achieve in terms of visualization and I got too convinced of my own sketch to appreciate reality?

In any case, the picture at the top of this post is as good as it got. We see that the blue dye is stopped by something located above the hockey puck (the Taylor column!), but all the turbulence in the dye curtain makes it difficult to see what is directly due to the Taylor column and what is just pretty 2-D turbulence.

But I haven’t given up on this! Here are a couple more attempts at Taylor columns in a tank under slightly different conditions. And if you have any suggestions, I’d love to hear them! 🙂

Swimming drones and new technology at NORCE

Swimming drones and cables that can measure everything from temperature to traffic intensity? Robots that can swim down and collect data from deployed instruments… and charge the batteries while it’s there? Souns like science fiction, but it is all happening at NORCE! Yesterday we visited Anne Hageberg and her colleagues at the marine technology department to learn about all the exciting stuff that they are developing. If things work out we will bring some of them on the next student cruise in March. That would indeed be cool!

Swimming drone I – the drone can be loaded with sensors and then programmed to swim where you want it to go… or controlled manually, if you prefer.

Swimming drone II – this demo-drone will hopefully soon be able to avoid crashing into things.

Nansen’s dead water explained on YouTube

Remember the experiment on Nansen’s observation of “dead water” that is part of GEOF213? Our movies of this experiment are now featured in a brilliant Youtube video by the german science communicator Doktor Wissenschaft! Check it out below! (It’s in German but we did include English subtitles)

How exciting that we can now share this experiment to a broad public, way beyond the audience that happens to find its way down into the basement! 🙂

Topographic Rossby waves in a tank

One experiment we wanted to run with the GEOF213 course this year were the Topographic Rossby Waves.

The idea is quite simple: We set a solid cylinder in the center of our tank and connect it with a ridge to the tank’s edge. The ridge is just a piece of hose that is taped radially to the bottom of the tank. We then spin the whole thing into solid body rotation. Once it is spun up, we add dye around the central cylinder. We then slow the tank down a tiny little bit, just enough so the water is moving relative to the tank and the ridge.

As the water now has to cross the ridge, it feels the water depth changing as it does so. A changing water depth results in changing relative vorticity to conserve potential vorticity, so the flow starts meandering.

In both the picture above and below you see just that: Upstream of the ridge, the flow is (relatively) steady. But downstream of the ridge, topographic Rossby waves start developing.

In the end, we felt like the experiment was too difficult to run to rely on it working out when presenting it in class. But that doesn’t mean that I have given up on it. I will conquer the topographic Rossby waves eventually, so stay tuned! 🙂

Internal lee waves in a tank experiment

Another tank experiment that is run in GEOF213 this fall is the one where we are moving mountains. Or at least one mountain. Read last year’s students’ account of the experiment here!

We move the mountain through stagnant water in a tank in order to simulate the flow of water over a ridge. This creates internal waves in the “lee” of the mountain.

Watch the movie below to get an impression of how cool this looks! And don’t be confused by the split screen after the time lapse ends, I was trying to give you the best of both cameras at once…

Instructions for how to set up the experiment can be found here.