How the strength of the current influences which path it takes. First observations!

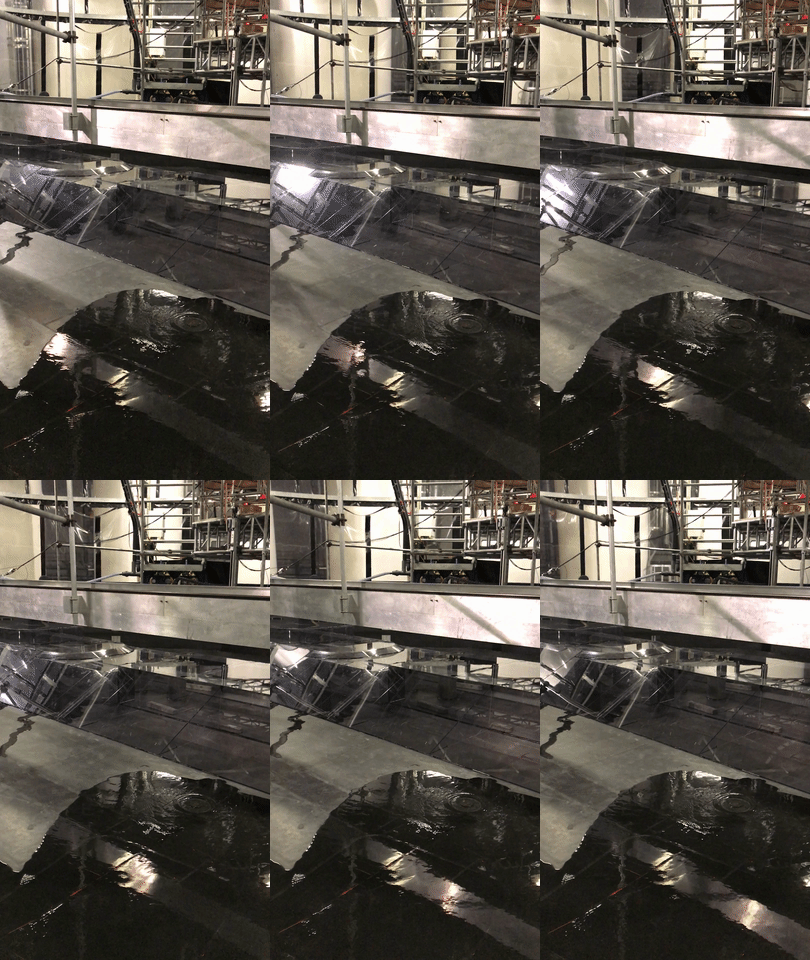
Depending on how strong a current we introduce in the 13-m-diameter rotating tank to simulate the strength of the coastal current in Elin et al.’s 2016 article (link on our blog, link to the article), it takes different pathway along and across our topography.

According to theory, we expected to see something like what I sketched below: The stronger the current, the more water should continue on straight ahead, ignoring the canyon that opens up perpendicular to the current’s path at some point. The weaker the current, the more should take a left into the canyon.

We have now done a couple of experiments, and here you get a sneak preview of our observations!

Small disclaimer beforehand: What you see below are pictures taken with my mobile phone, and the sketched pathways are what I have observed by eye. This is NOT how we actually produce our real data in our experiments: We are using cameras that are mounted in very precisely known positions, that have been calibrated (as described here) and that produce many pictures per second, that are painstakingly analysed with complex mathematics and lots of deep thought to actually understand the flow field. People (hi, Lucie!) are going to do their PhDs on these experiments, and I am really interpreting on the fly while we are running experiments. Also we see snapshots of particle distribution, and we are injecting new particles in the same tank for every experiment and haven’t mixed them up in between, so parts of what you see might also be remnants of previous experiments. So please don’t over-interpret! 🙂

So here we go: For a flow rate of 10 liter per minute (which is the lowest flow rate we are planning on doing) we find that a lot of the water is going straight ahead, while another part of the current is following the shelf break into the canyon.
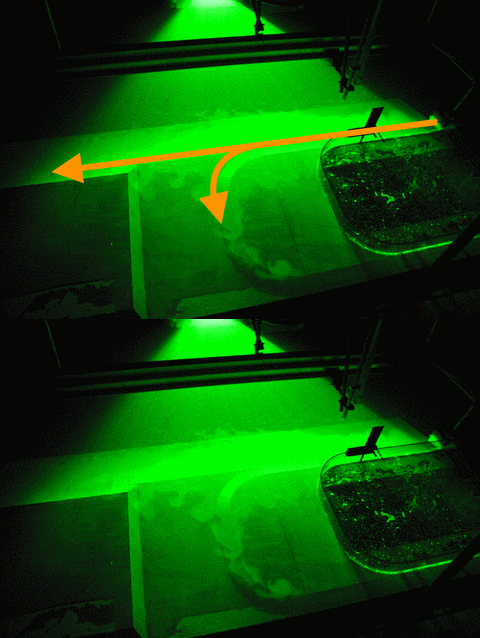
For 20 liter per minute, our second lowest flow rate, we find that parts of the current is going straight ahead, parts of it is turning into the canyon, and a small part is following along the coastline (Which we didn’t expect to happen). However it is very difficult to observe what happens when the flow is in a steady state, especially when velocities are low, since what jumps at you is the particle distribution that is not directly related to the strength of the current which we are ultimately interested in… So this might well be an effect of just having switched on the source and the system still trying to find its steady state.
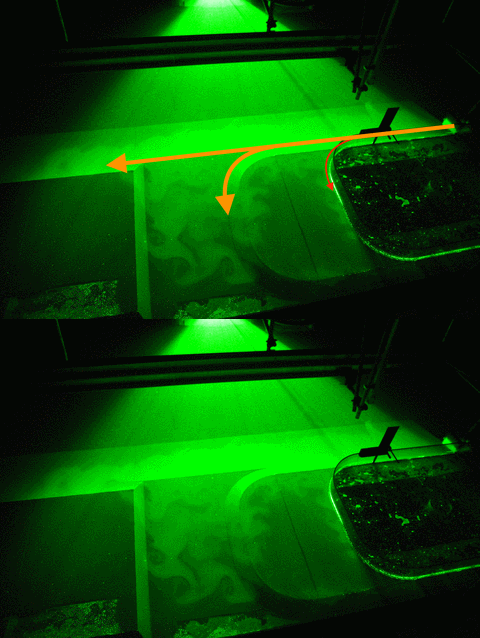
The more experiments we run in a day after only stirring the particles up in the morning, the more difficult it gets to observe “by eye” what is actually happening with the flow. But that’s what will be analysed in the months and years to come, so maybe it’s good that I can’t give away too many exciting results here just yet? 😉


We have water in our rotating tank! Now testing the lasers

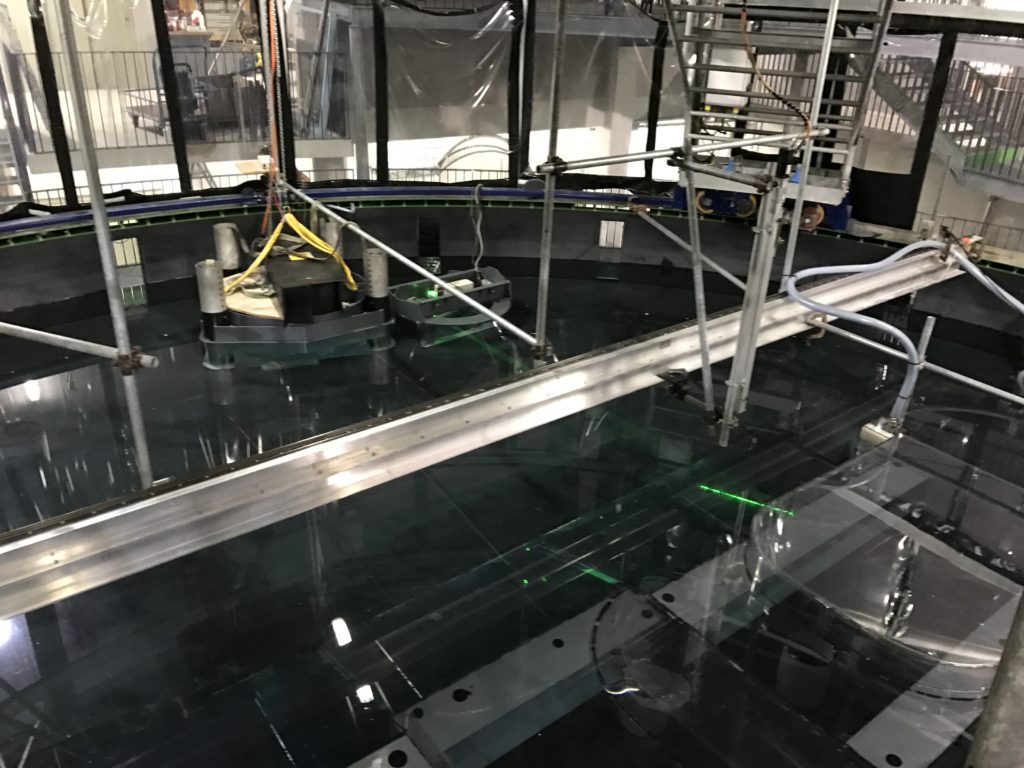
Above you see the very first water coming into our tank. Only a couple of hours, and the tank was full! And in solid body rotation (since it has been spinning all the time while being filled) which means that we can start doing the real experiments very soon! 🙂

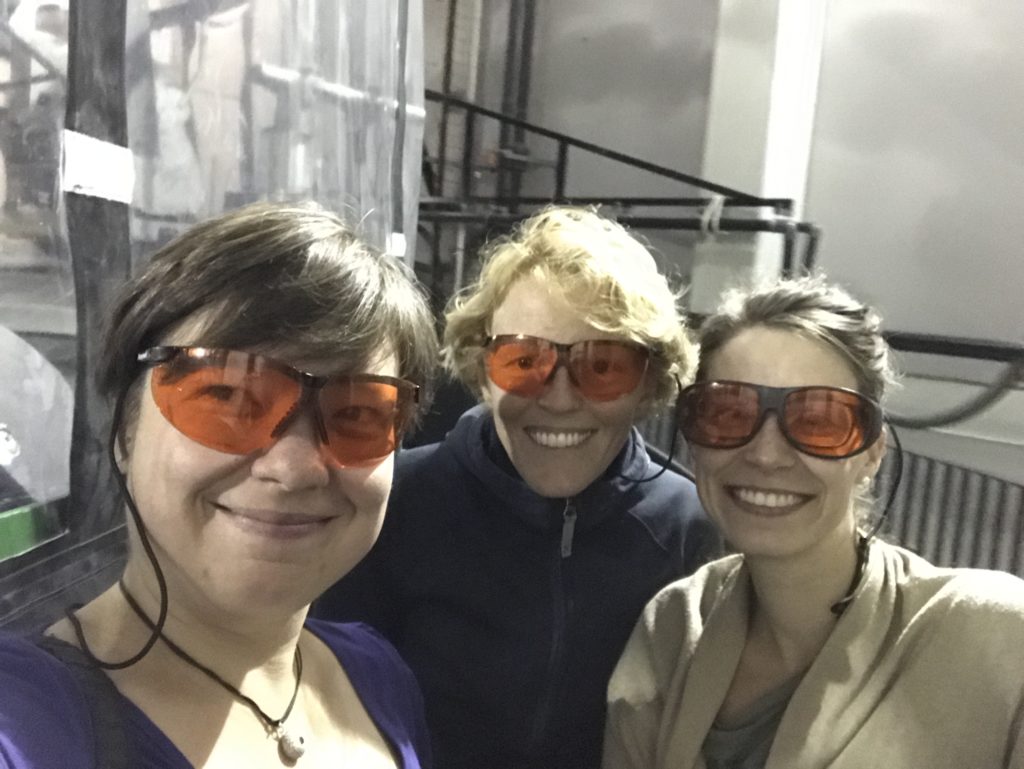
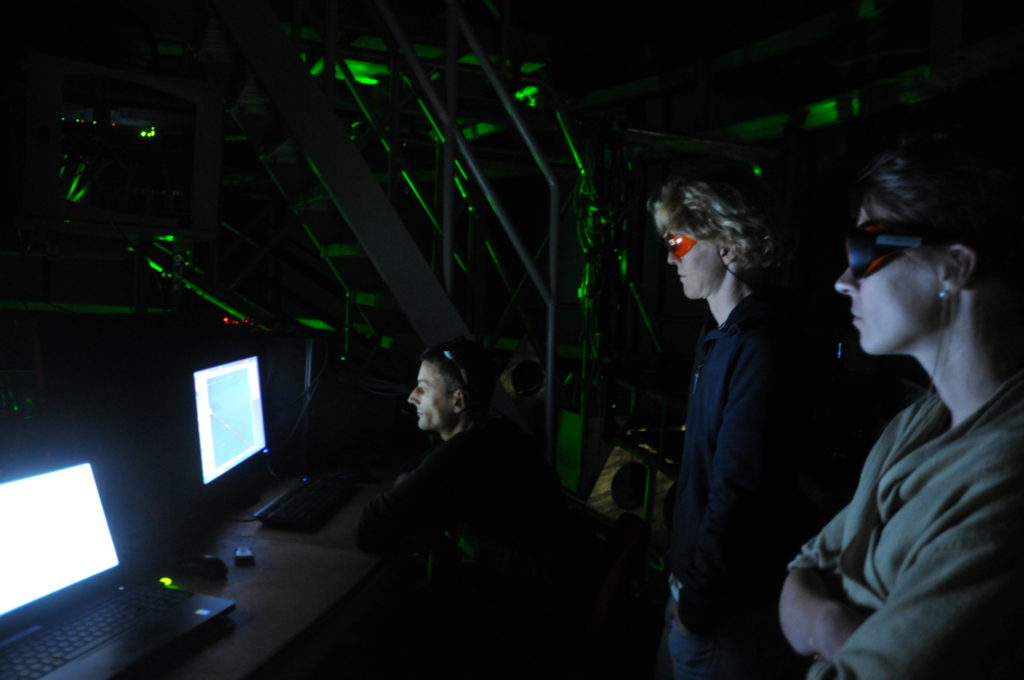
Most of the afternoon has been spent testing the lasers that will be used later to measure flow velocities inside the water around our topography. Laser testing isn’t something where we can help with, but that doesn’t keep us from having fun with safety goggles! Although it took us a little while to figure out that while the goggles made the laser invisible (or, hopefully, blocked it from coming anywhere near our eyes) we could see on the displays of our cameras whether the laser was on or off!

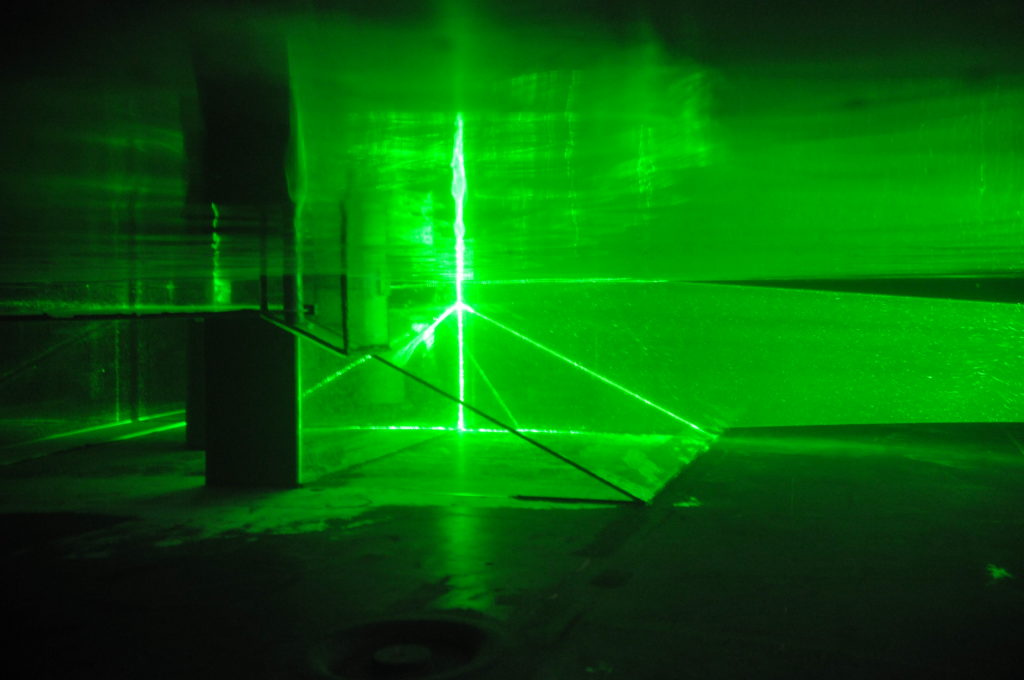
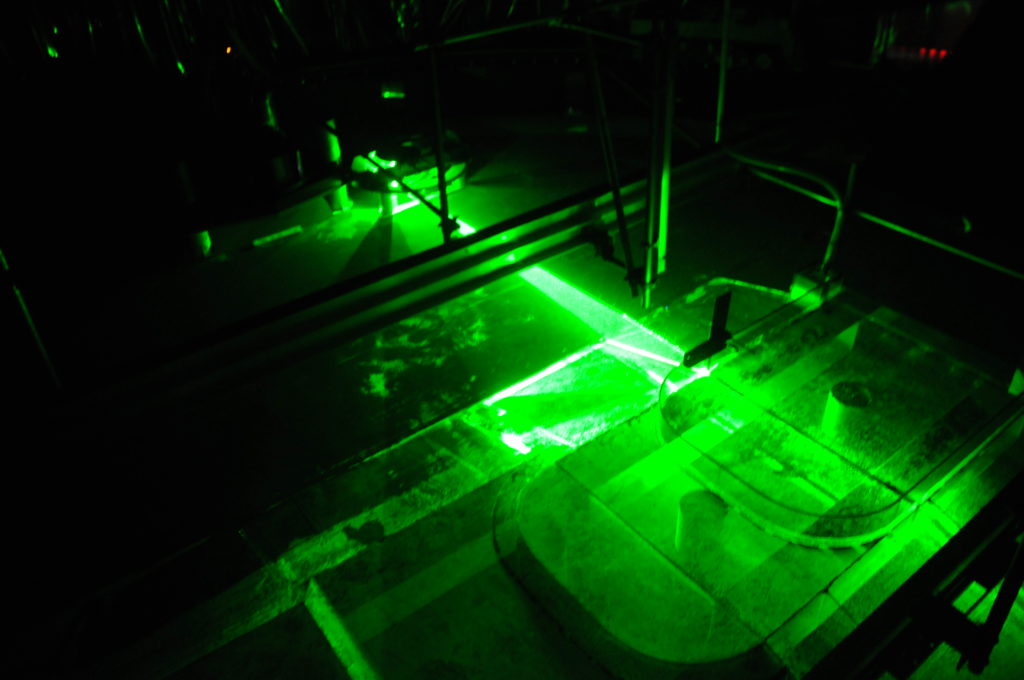
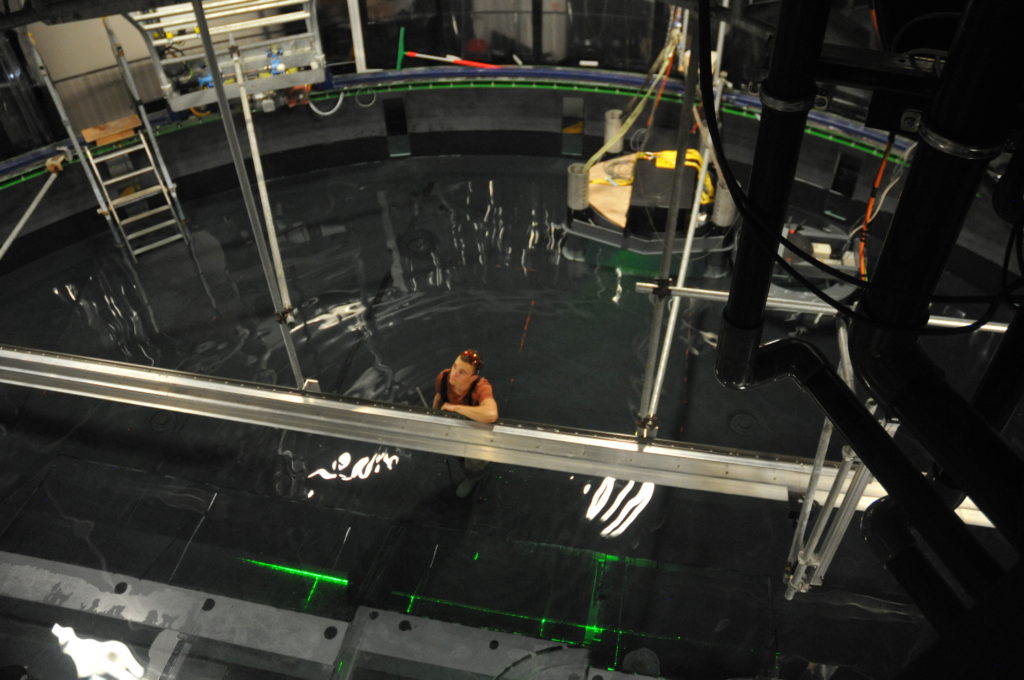
Below you see the laser going through the water and illuminating the topography in the lower right corner of the image.

What needed to be done then was to make sure that the laser sheet is actually at exactly the position we want it to be.

When you look in from the side through the water, you see the shape of our topography illuminated and the vertical laser sheet coming in from the right.

Same if you look in from the top: Do you recognise our little Antarctica? Below we see a vertical laser sheet.

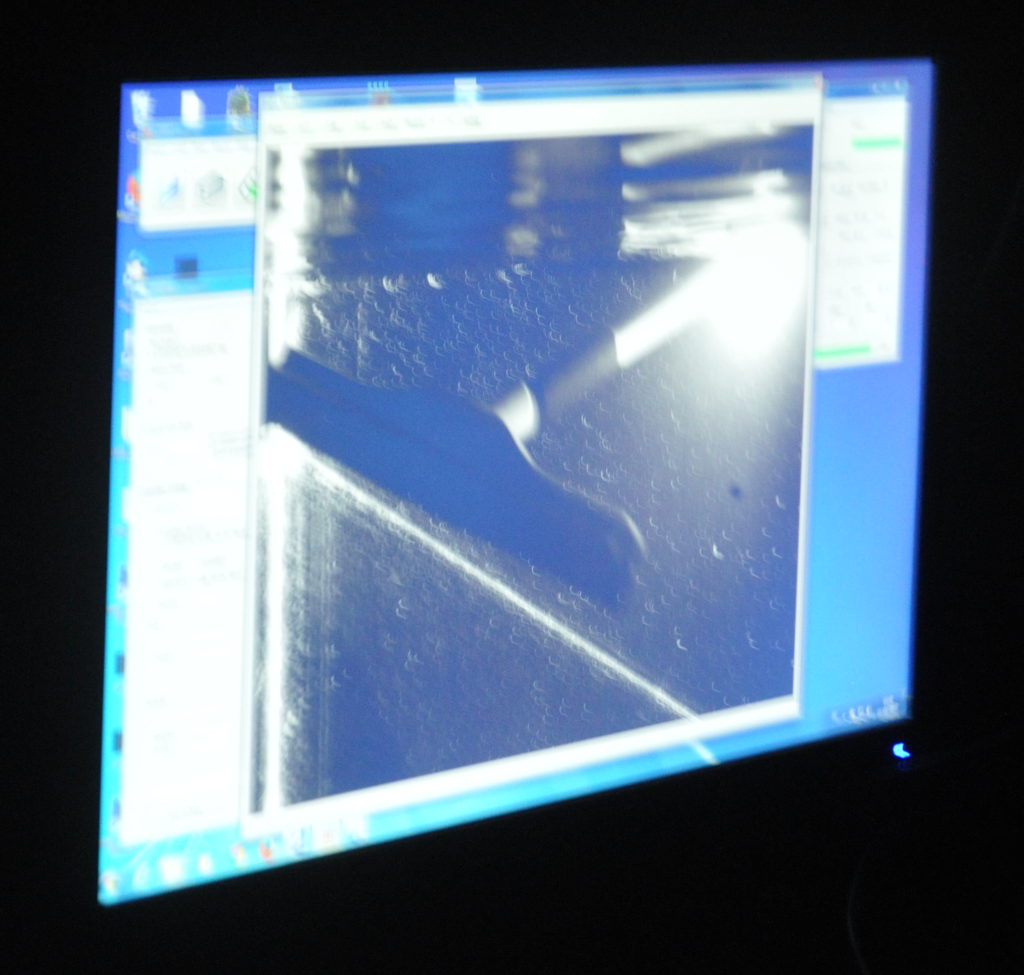
What the “official” camera sees can be observed on a screen in our second-floor office:

And what we saw is that there are way too many bubbles on the topography still, that show up as bright spots (which distract from the particles that we specifically seed to visualize currents). So: Someone needed to go in and clean…

We could observe on the screen how the bubbles were swept away!

Next, it was time to set the exact positions we want the laser sheets at.

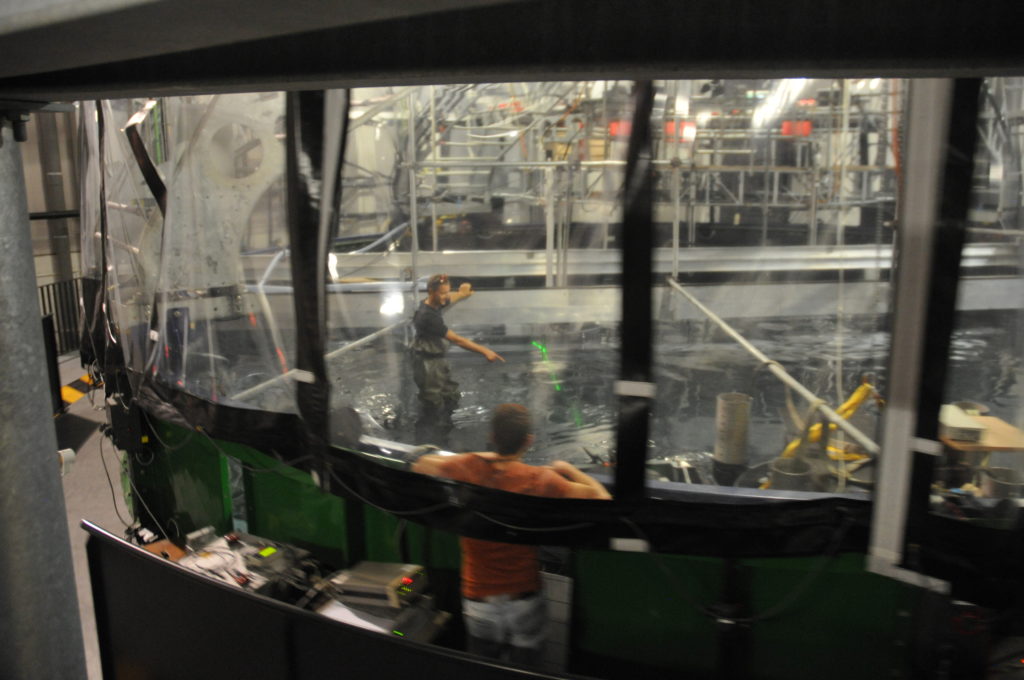
For the horizontal sheets, this is done by having someone stand in the tank and actually measure the height at which the laser hits a ruler for a given setting.

But now I am going to pick up Lucie, or new team member, at the tram stop and hope that we are ready to start the real experiments first thing tomorrow morning! 🙂

Calibrations and decisions

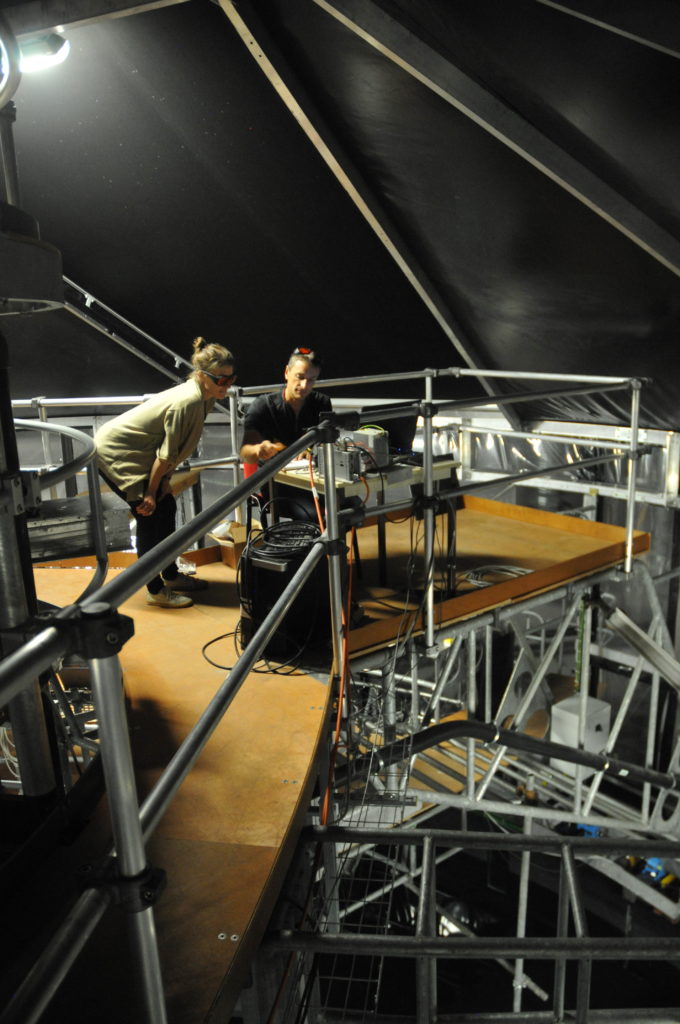
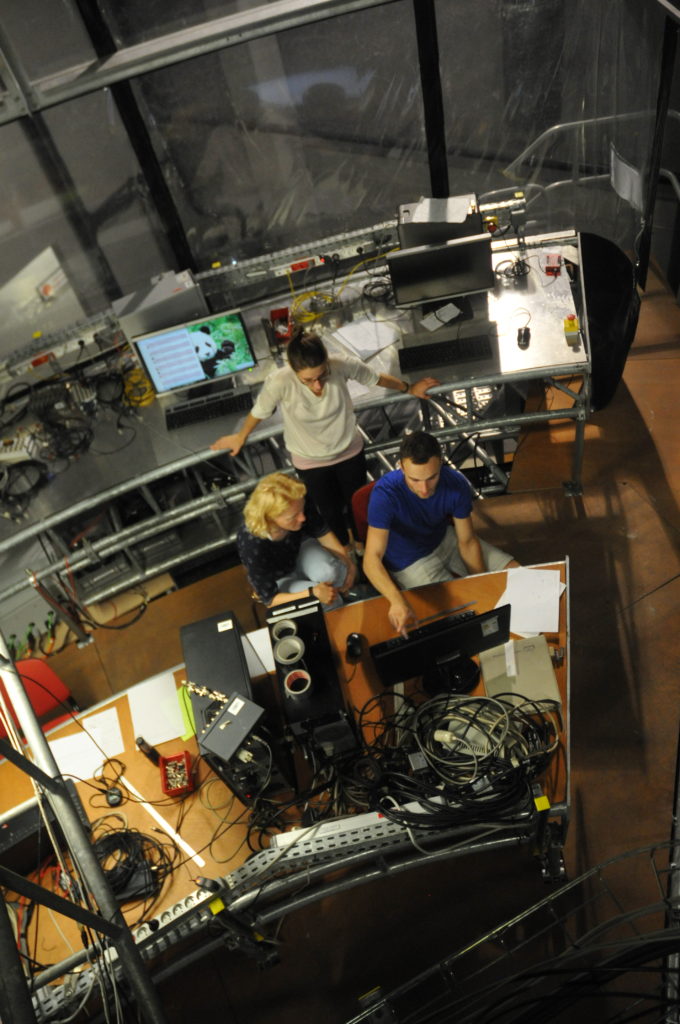
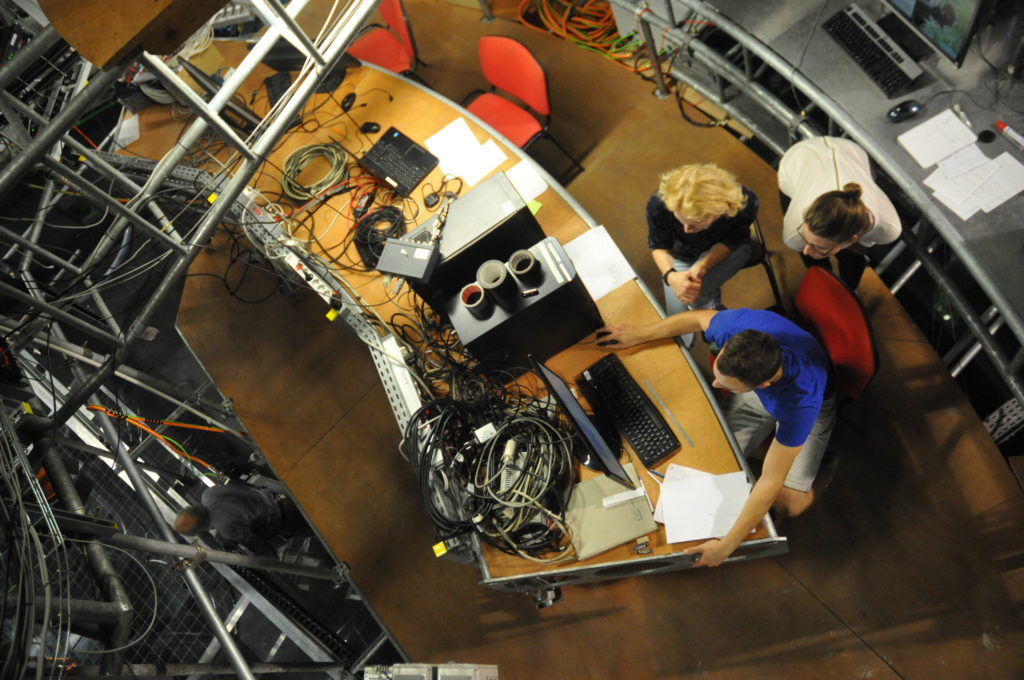
Remember this little office on top of the tank? Exciting stuff going on there: Testing of the cameras that were just being installed in the last post! (Of course it will get even more exciting once we start rotating! :-))

Of course we need to know which part of the tank the camera captures exactly, and what any given length on the pictures relates to in real life. That’s why we measured the topography in the last blog post.

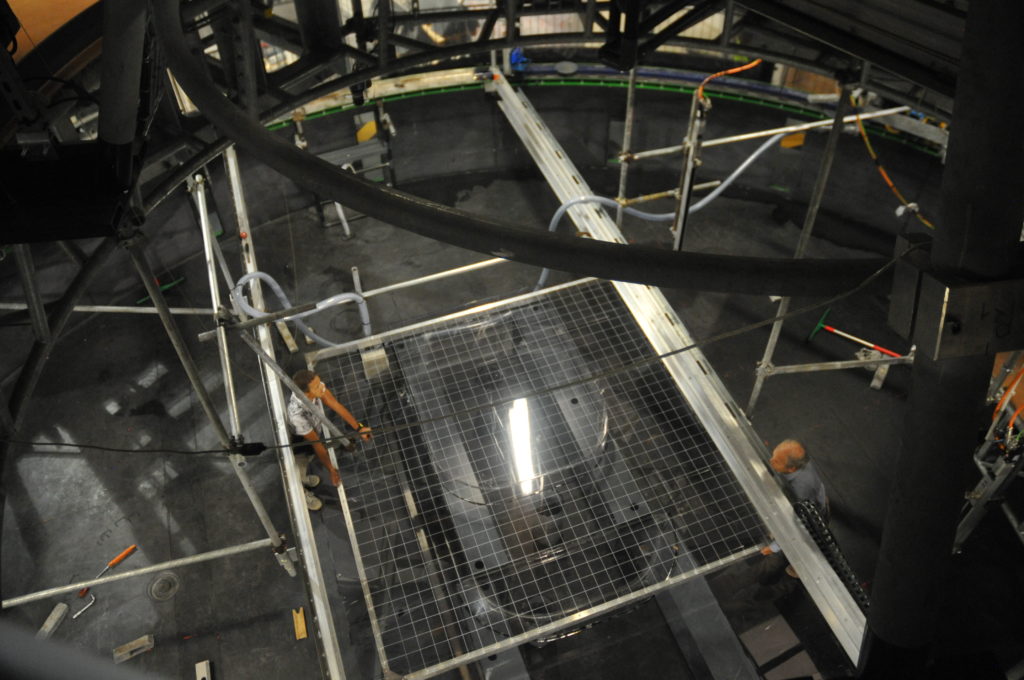
Below, you see that office again and additionally get a glimpse one floor down into the tank, and people moving a large grid there:

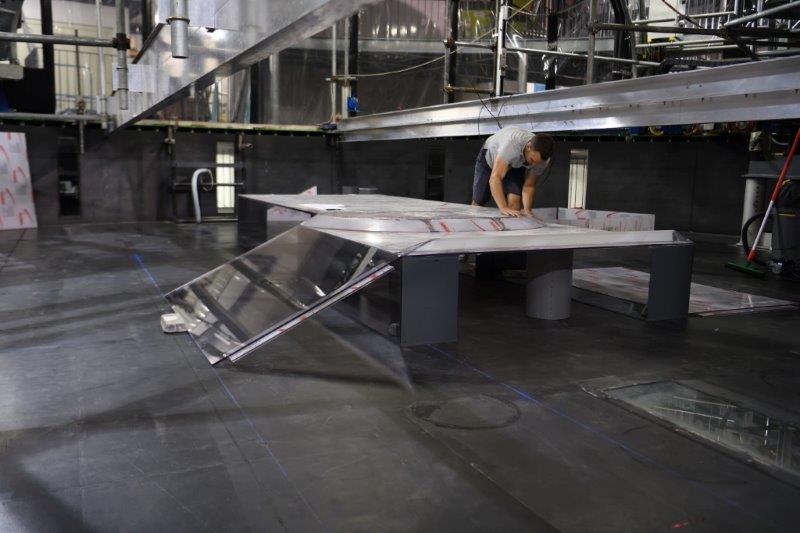
This grid, with exactly known dimensions and positioned in different ways above our topography, lets us calculate the focal length of the camera, which will ultimately give us the possibility to calculate back from pictures taken from far above to actual lengths in the tank. This is necessary to calculate the currents inside of the tank.

Easy as this sounds, I can assure you that it is not. So many considerations need to go into this now, for example where do we want to put the origin of the coordinate system when we interpret the data? And how should the axes be oriented? We are in the Southern Hemisphere, so should we use this to determine the direction of the x-axis? Or should the direction of the jet that we will be introducing into the tank give us our x-axis orientation? The source (where we will have the inflow of the jet later) seems like an obvious origin of a coordinate system, but we will move it around on the topography, so it really is not.

Decisions made now will make it a lot more convenient (or inconvenient) to work with the data for years to come, so lots of different considerations going on right now…

And there are two cameras that need to play well together, or at least the data coming from them needs to be connected seamlessly to each other…

Experiment: Coriolis

The world is turning around and around… all the time! And this has a big influence on where ocean currents go and how winds blow (It doesn’t, however, influence the vortex that appears when you drain your bath tub!). We call this the “Coriolis effect” or “Coriolis force”.

For the experiment, you’ll need:

  • a cutting board
  • a long ruler
  • glue or tape (to glue the ruler to the cutting board)
  • a pencil
  • a couple of pens
  • a white paper
  • a second pair of hands (someone to help you with the experiment)

Cut out a large* circle from he paper and pin it to the middle of the cutting board with the pencil (check with your parents first that they are ok with that!). Glue or tape the ruler onto the cutting board such that it goes over the paper circle.

Now draw a line along the ruler’s edge while your helper turns the paper circle clockwise. What do you see?

The paper circle represents the world as seen from the South Pole. What would the same thing look like from the North Pole? Turn the paper circle the outer way round to find out!

*but the diameter needs to be smaller than the length of the ruler!

Experiment: How cold can water get?

You need:

  • a bowl
  • a thermometer
  • ice cubes
  • salt
  • some water
  • something to stir with

Add water and ice cubes to the bowl and then add the thermometer. Stir a bit. What does the thermometer show?

Now add a little salt and stir well to solve the salt in the ice water. What happens to the temperature? What happens if you add even more salt? How cold can you get your water?

When a mixture of water and ice is in equilibrium, the temperature is at freezing point. When you add more salt, that lowers the freezing temperature (the more salt, the lower the freezing point) and the mixture is no longer in equilibrium.

Heat from the water is used to melt, and the temperature of the mixture sinks, either until all ice as melted, or until the temperature of the water is the freezing temperature.

Experiment: Archimedes’ principle

Everybody knows that once upon a time, Archimedes sat in his bath tub and all of a sudden shouted “Eureka!”. But do you know why he did that?

For this experiment you’ll need:

  • A large glass / jar / jug (which has to be see-through)
  • A small plastic mug (which fits inside your glass / jar / jug)
  • A couple of coins, small pebbles or something else “heavy”
  • An apple (or something else that floats)
  • A non-permanent pen

Fill the large glass with water and mark the water level on the outside of the glass. Then put the little plastic mug inside. Fill as many coins (or other “heavy” things) into the small plastic mug until it sinks. As you are filling coins into the small plastic mug, the water lever rises. Mark  how high the water level is right when there are so many coins inside the plastic mug that it sinks!

Now take all the stuff out of the large glass again. The water level goes back to where it was before.

What do you think would happen if we added all the coins to the large glass directly, without putting them inside the floating plastic cup? Do you think the water level would change? And if it changed, where would it end up relative to the two marks you already made on the glass?

Now try and check whether you guessed correctly!

Then do the experiment again, this time with the apple. What happens?

Experiment: What floats in the Dead Sea?

You have probably seen the picture of people floating on their backs in the Dead Sea, reading a newspaper or a book. But do you know why they are floating?

You need:

  • 2 large plastic containers
  • Water and a lot of salt
  • Different kinds of vegetables and fruits (or other things you might want to experiment with)

Mix a lot of salt with the water (salt dissolves more easily if the water is warm!) in one of the plastic containers to represent the Dead Sea, and fill the second container with tub water at the same temperature as your “Dead Sea”. In the Dead Sea, the salinity is 33,7%, that means to reproduce that you need ca 1 kg salt for 4 liters of water!

Now look at all your fruits and vegetables. Which, do you think, will float in the “Dead Sea”? Which will sink? Does your answer change if you look at your second container with tub water?

Flyter kokosnøtten? Fra Forskningsdagene i Bergen. Foto: UNI research

Does the coconut float? Fra Forskningsdagene i Bergen. Foto: UNI research

Experiment: Preparing a layered drink

With all the colourful liquids you can find in your kitchen, only your imagination is limiting what you can play with in this experiment!

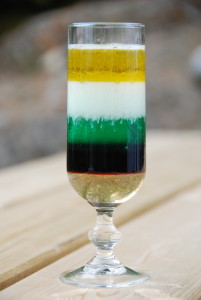
Start with the least dense liquid and carefully add the others with increasing density.

Here are a couple of examples of liquids you might have at home:

Baby oil –  0.83 kg/L

Rapeseed oil – 0.92 kg/L

Ice cubes – 0.92 kg/L

Milk – 1.03 kg/L

Dish soap – 1.06 kg/L

Black currant juice – 1.33 kg/L

Honey – 1.40 kg/L

Baby oil, milk, dish soap, black currant juice and honey… might not taste very nice, but certainly looks awesome! Foto: P. Langebroek

Experiment: Build your own thermometer!

Warm water needs more space than cold water — check it out in this experiment!

You will need:

  • 1 small plastic bottle
  • 1 drinking straw
  • modelling clay / play dough
  • Food dye (not strictly necessary, but more fun)
  • A large, high container in which the small plastic bottle can stand
  • cold and warm water

Fill the bottle with cold water (and add a couple of food dye if you like). The bottle should be completely full, so full that it is almost overflowing.

Place the straw in the bottle and lock the bottle with modelling clay. At least 10 cm of the straw should be left above the lock! Test that the lock is water tight by slightly pressing on the bottle. Water should now be rising in the straw, but not spilling out of the lock! It is not easy to get the lock completely watertight, you might need several attempts.

Now place the bottle in the larger container and fill the container with hot water (careful – don’t hurt yourself!). Wait a couple of minutes and observe what is happening. How high is the water rising in the straw?

Now put really cold water in the larger container instead of the hot water. What happens?

Try this for different water temperatures – lukewarm, really hot, medium hot, cold, etc. What happens now?

Researchers have found out that the water in the deep ocean is slowly warming. What do you think the consequences will be?