
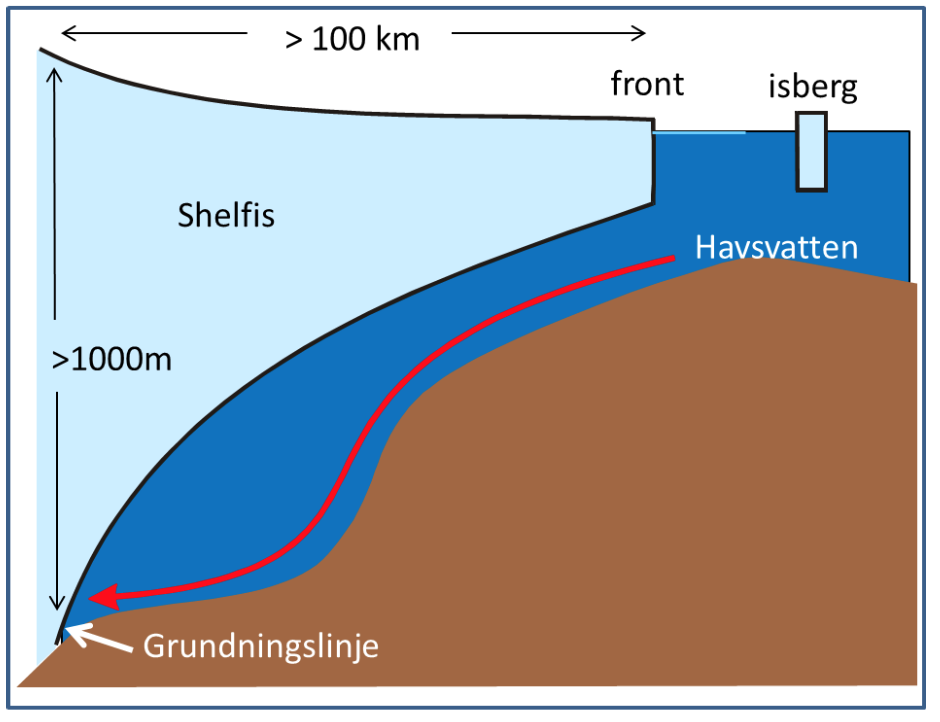
The freezingpoint of seawater sinks with increasing salinity and with increasing pressure – the more sline the water is, or the higher the pressure is, the more you can cool down the water before it freezes. Water from the tap freezes at 0 0\(^\circ\)C and sea water at -1.9\(^\circ\)C. At 1000m depth you can cool down seawater to -2.6\(^\circ\)C before it freezes. Below the large ice shelves around Antarctica seawater gets in contact with ice at large depths. When water is in contact with ice, it will melt ice and cool down to its freezing point. Below the Filchner-Ronne ice shelf in the Weddell Sea the grounding zone (see figure) is located at 1800 m depth. Here the water can become very cold!
Exercise 1
The freezing point is a function of salinity and pressure \(T_f=T_f(S,P)\). For a constant P (i.e. at one depth level) and for small changes in salinity the freezing point is a linear function of salinity and we can write \(T_f=kS+m\).
a) We know that \(T_f(S=34.4,P=0)=-1.8879^\circ C\) and \(T_f(S=34.7,P=0)=-1.9051^\circ C\). Determine the coefficients \(k\) and \(m\).
b) What is \(T_f(S=34.5,P=0)\)?
c) Vad är \(T_f(S=0,P=0)\)? Is this right? Why/why not??
In a similar manner, we have that (for a given salinity) \(T_f=kP+m\).
d) We know that \(T_f(S=34.5,P=0)=-1.8936^\circ C\) and \(T_f(S=34.5,P=1000dbar)=-2.6466^\circ C\). The pressure increase by about 1 dbar per meter, so the pressure is about 100 dbar at 100 m depth, 200 dbar at 200 m depth and son on. Determine the constants \(k\) och \(m\).
e) What is the freezing point at 2000 m depth?
f) My collegue Svein Østerhus have been drilling through the thick ice on the Filchner-Ronne ice shelf and made observations of the water in the cavity beneath the ice. The lowest temperature they observed was -2.53\(^\circ\)C, the salinity was 34.5. What is the smallest depth the observations can be from?
h) What temperatures could you expect to observe at the grounding line (1800m)
Exercise 2
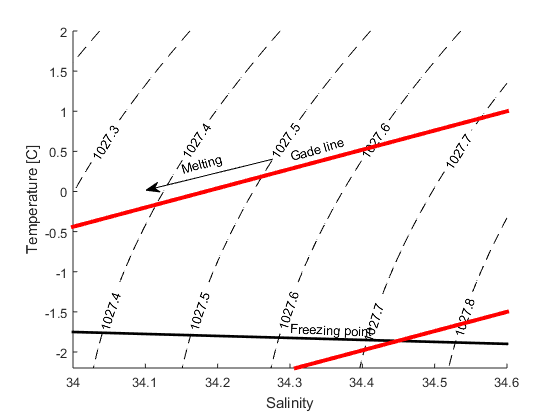
When ice melts in salt water two things happen: the temperature sinks, since the heat from the water is used to melt the ice, and the salinity decreases, since the seawater is mixed with the fresh melt water. To melt a certain quantity of ice we need a certain quantity of heat, if we were to melt twice as much ice, we’d need twice as much heat. The change in temperature is proportional with the change in salinity \(k=\Delta T/\Delta S\)=2.4. A line with a slope of 2.4 in a TS-diagram (a diagram with salinity on the x-axis and temperature on the y-axis) shows how the the salinity and temperature changes when ice is melting in seawater. It is called a “Gade line” (see figure below) after professor H. Gade at UiB.
b) How salty is the water when T=0\(^\circ\)C?
c) How saline is the water when it is at its freezingpoint? Here you’ll need to use the expressin for the freezingpoint that you found in exercise 1 (P=0)
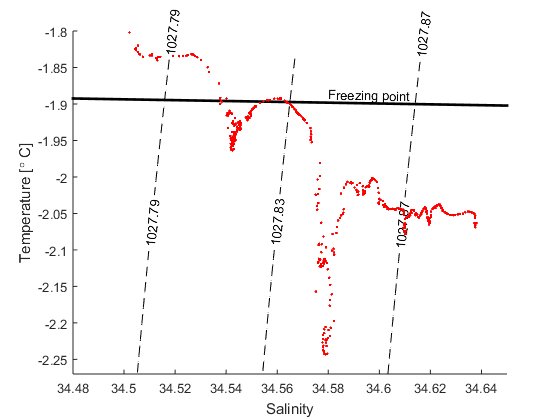
d) The figure below shows a TS-diagram with data from a CTD station (ENG_Filchner_CTD) that was occupied at the front of the Filchner ice shelf when I was there a few years ago. What was the lowest temperature we observed? How saline was that water?
e) Find the expression for the Gade line that goes through the T,S point from (d) and plot it together with the data and the line that gives the freezing point (from exercise 1, P=0)
f) Most of the water entering the Filchner cavity is at its surface (P=0) freezing point. How saline was the coldest water thtat we observed when it entered the cavity, that is, before it melted ice?
Using the Gade line we can determine how saline the water that exit the cavity was when it entered the cavity. Since we know how the salinity changes along the front of the ice shelf (it increases the further west you go) we can also determine where the water entered the cavity