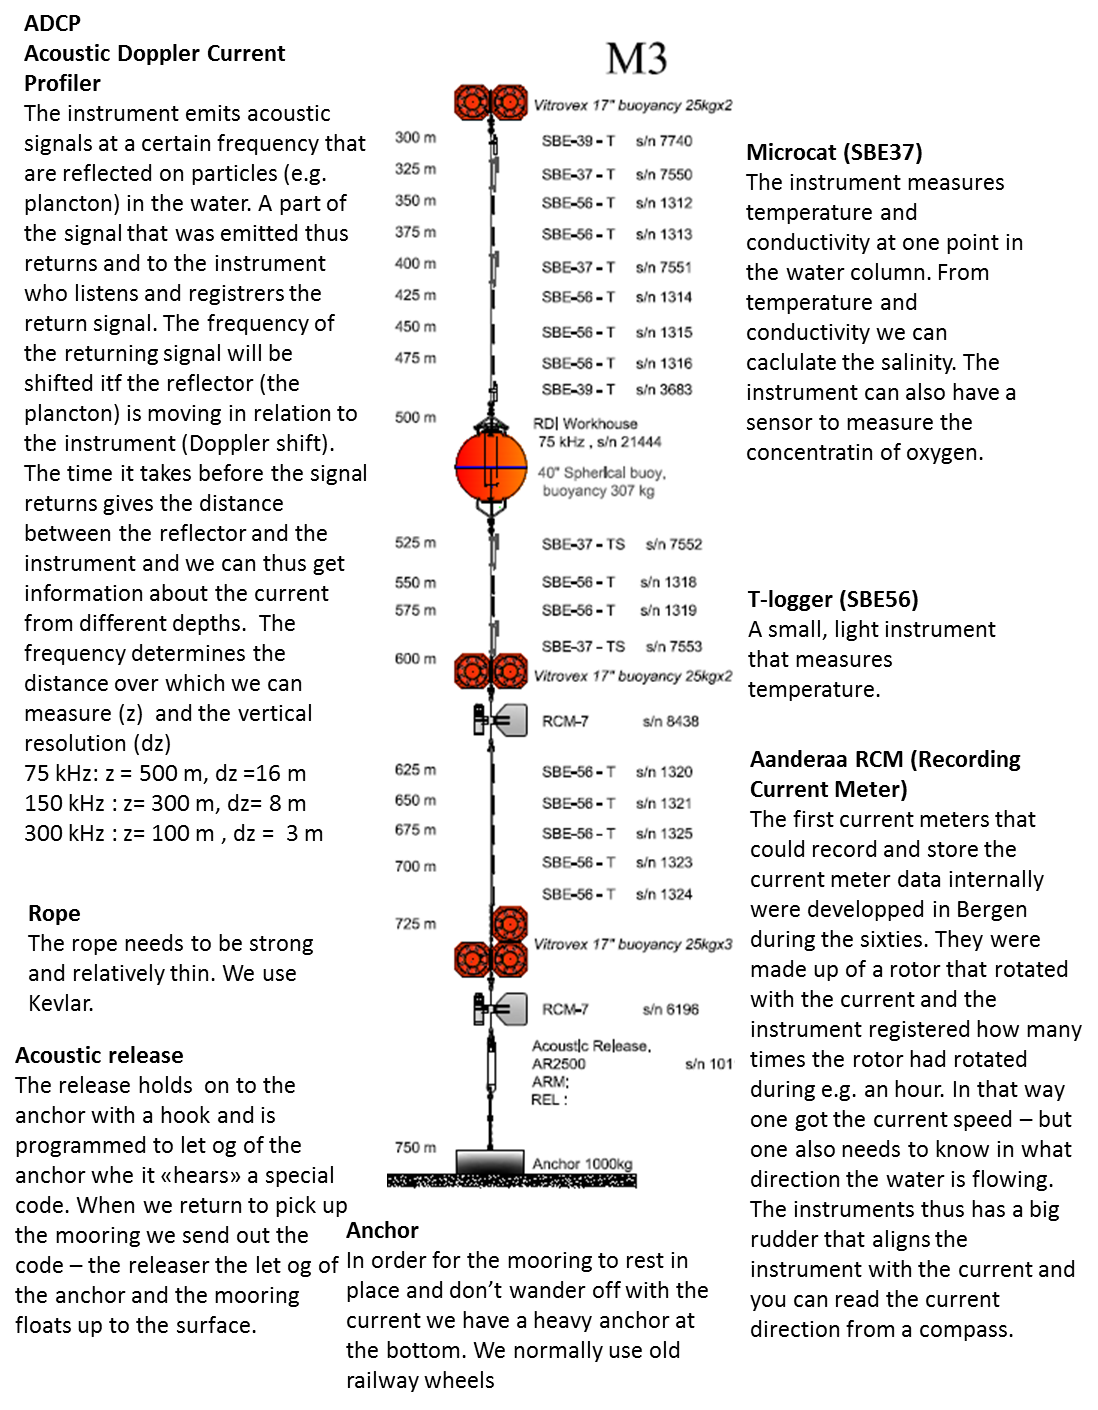
We go on scientific expeditions to the Amundsen Sea every other year or so, and then we do a lot of measurements and learn what things are like right then, when we are there. But we’d off course want to know also what happens when we are not around. To do so we deploy “moorings”. A mooring is and anchor, a line on which we attach instruments and floating elements to keep it upright in the water. The moorings are standing on the bottom and measures (normally currents, salinity and temperature but I’ll also have sensors to measure the concentration of oxygen) until we return a year or two later. What the mooring looks like and what instrument we put on it will depend on what we want to measure. At the bottom of the page there is a drawing of one of my moorings!
Exercise 1
Now you can design you mooring! What would it look like if you’d want to:
a) Study the evolution (salinity and temperature) of the surface layer (let’s say the upper 200 m) over a year in a area where the water is 500 m deep?
b) Study a bottom current that extends 300 m above the bottom
c) Find out how much warm water is entering the cavity below an ice shelf. The depth is 800 m and the draft of the ice shelf is 300 m deep (which means that ice bergs can reach just as deep!!)
Exercise 2
Do the following calculations for you mooring from above or for a mooring which has
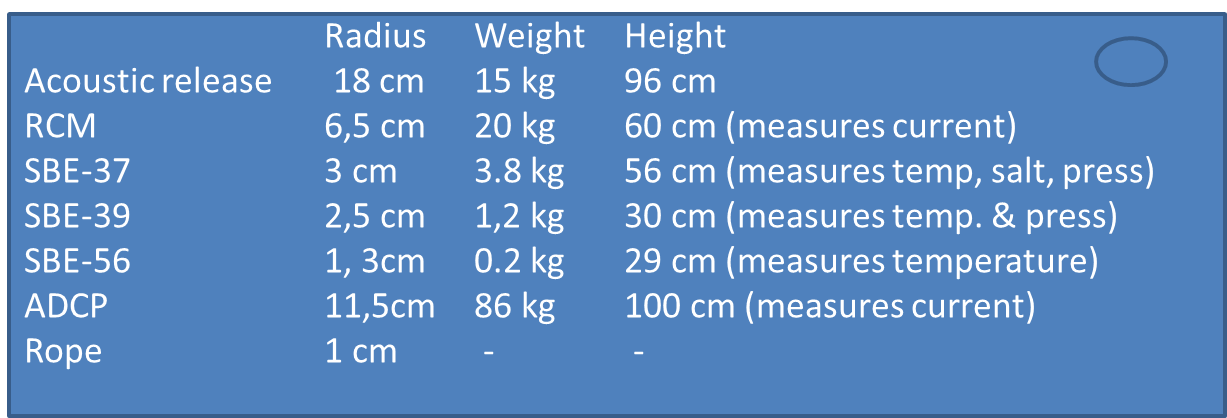
1 x acoustic release (25 mab); 3 X SBE37 (25, 150 and 300 mab), 1 x RCM (50 mab) 1 x ADCP (300 mab) and 5 x SBE56 (50, 75, 100, 200, 250 mab). Mab = meters above bottom.
The instrument has the following dimensions (they are all roughly equal to cylinders)
a) What is the weight of all the instruments in air? In water?
The mooring also needs floating elements to stand up in the water.
b) How much can one glass sphere lift? Their diameter is 43 cm and the weigh 22 kg in air.
c) How many spheres do we need to keep the mooring up right?
Exercise 3
When the current is strong it will tend to pull the mooring down towards the bottom – that is not good. Firstly, you don’t get measurements from the depth you wanted and secondly, many of the instrument cannot measure when they tilt too much, An ADCP, for example, cannot measure correctly if the tilt is above 15 \(^\circ\). So we need to add extra floating elements to make sure that the mooring is not pulled down if the current is strong. The force from the water pulling the mooring down is proportional to the area that the water hits (i.e. the cross sectional area of the mooring).
a) What percentage of the mooring cross sectional area is made up by the rope?
b) By how much is the area reduced if we change for a line that is 6 mm in diameter?
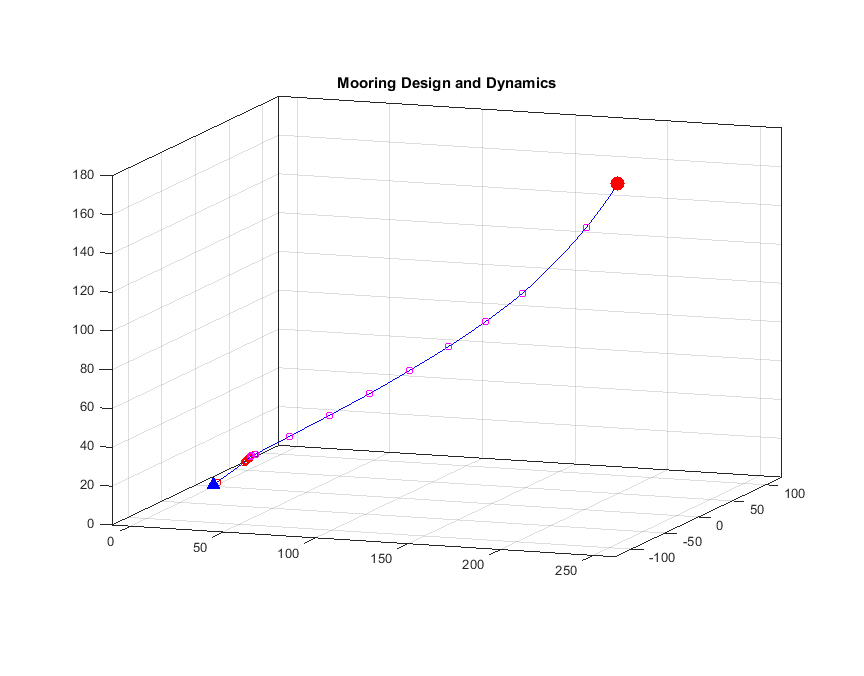
c) An instrument was pulled down to 170 mab and 218 m downstream, another instrument was pulled down to 65 mab and 105 m downstream. The shape of the line can be decribed by (half) a parable. Find the expression for the parable!
d) The pressure sensor on the ADCP shows that it now is 40 mab. How much is it tilting? Can we use the measurements?
e) How high up must it be (at least) for the measurements to be good?
f) Why do you think we prefer to have the ADCP high up looking down, rather than deep down looking up?
Exercise 4
When we retrieve the mooring and download the data from the instruments we get time series of current, temperature and salinity. We will now do some calciulations based on data from a mooring that was deployed in the Amundsen Sea in 2012.
a) Import and plot the current measurements from mooring S4, 17-24 June 2012 (ENG_Riggdata_S4_1). Describe what you see!
b) What is the mean current? In what direction was the water flowing? (\(u\) is the current in the \(x\)-direction (towards the east) and \(v\) is the current in the \(y\)-direction (towards the north))
c) If you were to describe the observations with a mathematical function, which one would you chose?
d) Determine the coefficient of your function!
e) An iceberg is floating with the current in the vicinity of S4. Set up an expression for it movement (using vectors) and plot its trajectory. How would you describe its movement?
f) Plot the current a week forward in time using your function from (d).
g) Import the data from S4 24/6-1/7 and plot it in the same figure. Is your model doing a good job predicting the currents? Why? Why not? (The file is named ENG_Riggdata_S4_2)
Exercise 5
Import and plot the measurements of pressure from mooring C2. The file is named ENG_Riggdata_C2. In this location the currents were much stronger than we expected and we had put on too little flotation 🙁
a) How would you interpret the record? (hint – look at exercise 2 above)
b) At what depth is the instrument located when the current is weak? (1 m \(\approx\) 1 dbar)
c) How deep is it pulled down?
d) What percentage of time is it pulled down more than 40 m? 80 m?
e) \(u\) gives the current in the \(x\)-direction (towards the east) and \(v\) gives the current in the \(y\)-direction (towards the north). Set up an expression for the current strength the calculate and plot it! How strong is the strongest current? The mean current? How many km/h is that?
f) Is there a relation between current strength and pressure (that is, the instrument pull- down?) Describe the relation mathematically and with words.
Exercise 6
The instruments are powered by batteries, and every time we make measurements we use a small amount – or a lot if it is an ADCP – energy. We want the instruments to keep measuring until we get back to pick them up – so we have to calculate beforehand how often we can make measurements without emptying the battery. But we also have to think about e.g. tides when determining how often to sample.
a) One of the components of the daily tides has a period of 25.8 h. The tidal current can be described by a sinus curve. The amplitude (and the phase) depends on where we are, but let’s assume the amplitude is 10 cm/s and the phase is 0. Set up an expression for the tidal current and plot it for 30 days.
b) If we made measurements only once a day, what would or time series look like?
c) What is the period of the “oscillation” that we would then observe?
d) The tidal current tha we observe is the sum of many components with different periods, amplitudes and phases. Another component has a period of 23.93h. Set up an expression for that tidal component if the amplitude is 9 cm/s. (You can set the phase to 0) and plot the sum of the two components. What do you see? How is the amplitude changing? How far is it between to “amplitude maximum”? Can you explain what you see? (hint: plot the components as well as the sum of them). Compare the results with the results from exercise 3!