Meet Vår Dundas – and follow her on her journey to Antarctica!

When asked whether you want to go to Antarctica during regular times, there’s just one sensible response. When asked whether you want to go to Antarctica during highly unusual times, there’s still really only one possible response – you grab the opportunity with both hands, and you go to Antarctica. In a week, I’m starting a slow but steady journey towards Antarctica. I thought I’d write a bit about everything that’s happening now, the plan for the cruise and preparations. But first, since this is my first contribution to the blog, I’ll start by introducing myself.

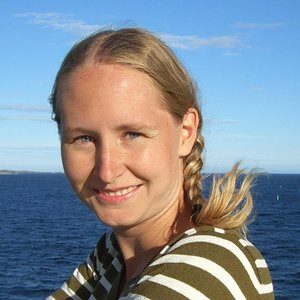
Vår Dundas started working as a PhD-student with Kjersti and I this summer – now she is off to Antarctica. Photo: Private

I’m Vår, and I started my Ph.D. this summer at the Geophysical Institute in Bergen with Elin and Kjersti as my supervisors. Right now, I’m working with mooring data from the Amundsen Sea, but the next step is to begin a combined model and mooring study from the Weddell Sea. There, I’ll be looking mostly at shelf-break interactions at the Filchner trough opening and look for wind-field conditions favorable for far-reaching on-shelf heat transport.

Since I started working with Antarctic oceans, I’ve had a small hope that I would get the chance to join a cruise and go there sometime. So when I one Monday morning in the middle of October opened my inbox to find an email with the header ‘cruise’, stating that there was a possibility that I could travel to Antarctica this winter, I was slightly speechless and very excited. After a week or so with anticipation, I got a confirmation that I would be able to join the cruise. Since then, the practical details have started to dawn on me: In total, we’ll be gone for two months (including Christmas and new years). Of these two months, we will spend about 7 to 10 days in Antarctica. So how does this add up? Due to Covid, we start off by spending one week in isolation at a hotel in Denmark. After this, we board the ship but need to stay in port for a week to finish our two quarantine-weeks.  We then start our transect southwards, which takes four weeks. Reaching Antarctica, we do our science for 7 to 10 days (fingers crossed for 10) before a week-long transit takes us to Cape Town, and we fly home. I realize that I dread the first week of isolation, but then again, when you’re able to go to Antarctica, there’s just one sensible response.

The Norwegian Polar Institute is organizing the scientific work on this cruise. In total, the science team will consist of five people: Tore Hattermann, Kirsten Forssan, Sebastien Moreau, Julius Lauber, and myself. The plan is to make our way to the Fimbull Ice Shelf, where they have moorings that need some updates. These moorings are located along the continental shelf-break, where the ocean depth suddenly drops from a few hundred meters to about 2000 meters. Processes along this shelf-break are crucial for the southward flow of warm water, and consequently, important for how much the ice shelves melt. These moorings are also upstream of known regions where warm water flows in under the Fimbull Ice Shelf, where other moorings are located. A mooring array here can therefore provide valuable information on how upstream conditions affect the Fimbull Ice Shelf.
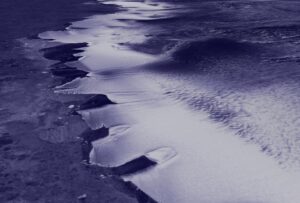
The Fimbull Ice shelf (Photo credit: NASA/Goddard Space Flight Center Scientific Visualization Studio. Additional credit goes to Canadian Space Agency, RADARSAT International Inc. )

In addition to the mooring retrivement and deployment, we will run a couple of CTD-sections (conductivity for salt content, temperature, density) and (hopefully) measure turbulence along the ice shelf front and underneath the fast-ice cover. If the weather permits it, we will also go onto the ice and measure properties underneath the ice.

The ship we are traveling with is not a usual scientific ship, but a freight ship, traveling southward to supply the Troll station. This means that it does not have the scientific equipment installed – we have to make a make-shift scientific deck with labs and winches ourselves. If this works out well, it will open up for new possibilities, where scientific data collection and supply missions can be done all at the same time, which is actually quite exciting.

Right now, I’m trying to get my head around everything I have to get done before I leave. It’s challenging to think about learning how to use the MSS-instrument and remember to download all the data I think I might want to work with for the next two months, at the same time as deciding how many woolen socks I need and what I’ll wear for Christmas. Still, I just shipped off one bag to the ship, I’ve gotten my health and teeth certificates signed, so I think I’m getting there. And there’s still one week left before I’m off.

Written by Vår Dundas.

UN9031 on the road!

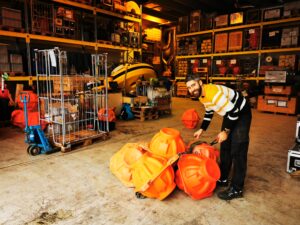
Algot Peterson and bright orange buoys that are to keep my moorings upright in the Weddell Sea. Photo: E. Darelius

My five pallets with equipment for this winters expedition to the Weddell Sea is now finally on their way to Bremerhafen & Polarstern! Many thanks to Helge and Algot for helping me packing and preparing – and to Tor for taking over when they ran away with Ilker to the Barents Sea, leaving me to finish up all the paper work – freight lists and proforma invoices are luckily not part of my standard vocabulary, but during the last couple pf weeks it feels like I’ve been doing nothing but that… and I’ve definitely learnt more about dangerous goods and codes like UN9031* and LQ** than I ever wanted to know! I do appreciate that Helge & Algot are back ashore!

*Li-batteries contained in equipment

*Low quantitity

Stefanie’s current!

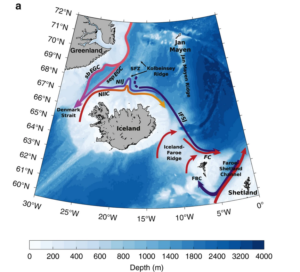
Although the Ocean still holds many secrets, it’s not very often nowadays that oceanographers discover new currents – but earlier this week one could read in NatureCommunications (and on nrk.no, in Norwegian) that scientists have drawn a new arrow on the map showing current systems in the North Sea! The “new” current brings dense water eastward along the Greenland-Scotland ridge from Iceland towards the Faroe Bank Channel, through which the dense water continues southwards into the North Atlantic.

I was very excited (and admittedly a litte bit proud!) to read about the discovery – since the paper is written by Stefanie Semper – the very first Master’s student that I supervised on my own. Stefanie has just submitted her PhD-thesis here at UiB, and I’m certain she will continue her great scientific work and that I’ll have the pleasure to read about her findings in the future!

The name of the current? Well, it’s not officially “Stefanie’s current” (although I’ll think of it as that) , but the slightly more descriptive (although boring) “the Iceland-Faroe Slope Jet”.

Stefanie’s current – (or the Iceland-Faroe Slope Jet) is the black arrow that originates north of Iceland and continues eastward towards the Faroe Bank Channel. From: Semper et al, 2020, Nature Communications. CreativeCommon License 4.0

Science is a team sport

The upside of the pandemic is that a lot of interesting meetings and presentations are streamed and recorded so that one can “shop around” and participate & listen without worrying about neither time zones nor CO2 and travel budgets.

Last night I had the pleasure to listen to Fiamma Straneo’s lecture “Ahoy captain, is that a glacier up ahead? Lessons learnt from working in Greenland’s marine margin” which is part of the International Glaciological Society Global Seminar Series (freely available here). I write “listen”, since the children’s drawers were empty and I had to do laundry at the same time – so I probably missed out on a lot of nice graphics and photos from the Greenlandic fjords that she was talking about… but I did not miss out on her conclusions:

Fiamma Straneo’s conclusions during the her talk in the IGS Global Seminar Series (https://www.youtube.com/watch?v=QpvjxoNWSLc)

Fiamma, who is a physical oceanographer working at Scripps while holding a Prof II position at UiB, and who is very much a team-player herself, used examples from her own research – from multi-disciplinary field campaigns in remote fjord arms to the (equally) multi-disciplinary and diverse team that stands behind the ISMIP6 projections –  to support her conclusions, and she did so very convincingly. Science is indeed a team sport!

Welcome to GFI, Mari!

Yesterday Mari Myksvoll visited me and the oceanography group at GFI and we had a nice chat about fjords, oceanography, and everything in between! We are lucky to get to see Mari more regularly in the hallways from now on, as she soon will be joining us (20%) as an Associate Professor II. The paperwork is not yet in order, but the university administration better hurry up since the plan is that she will be teaching GEOF337, the master’s course in fjord oceanography, next semester. With her background in fjord and coastal modelling – and with her enthusiastic smile – I’m sure she will do a great job! And I will for sure enjoy to have another female*, fjord-interested oceanographer around! Welcome to GFI, Mari!

Mari S. Myksvoll will join us at GFI as Ass. Prof. II next semester!

* number three in the teaching staff

Science for young minds!

Our ice shelf work is now available in a “young-mind-version” – have your daughter / son / grand children / children of your neighbours / random kids in the street and everyone else with a young mind check it out here ! And have a look yourself too while you are at it! It’s a lot easier to read than the text in Nature – and the illustrations are really cute!

Many thanks to Mirjam and to the two young reviewers (Margarita and Isabel) for making this happen!

New article in Frontiers for Young Minds about ice shelves and warm ocean currents. from: https://kids.frontiersin.org/article/10.3389/frym.2020.00124


More than 25000 persons…

… read the article about our findings in Masfjorden that was published in Bergens Tidene, the local newspaper, this Monday! That’s a lot of people! The article is behind a pay-wall, but the journalist who wrote it, Atle, kindly allowed me to publish it here for those of you who missed it (and who reads Norwegian), so here it is:  Her kan fjordbunnen være i ferd med å dø (Originally published in BT 7/7 2020)

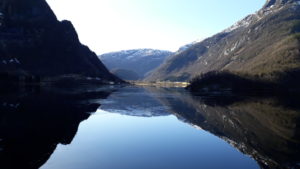
Beautiful – but oxygen poor –  Masfjorden

Luckily not everybody who read the article contacted me – but quite a few did; friends that I haven’t seen in ages who congratulating me on messenger, colleagues giving thumbs up on Teams, people  writing me to ask if I know anything about the situation in “their” fjord and a few Norwegian scientists that I’ve never met who asked me to send them a copy of the original paper (which is freely available here)… a very positive experience, indeed!

BT and Atle are planning to write more about oxygen and fjords – and I’ve already volunteered to contribute 🙂

Editor’s choice!

I just learnt that Svenja Ryan’s paper (with the exceptionally prolonged title?) “Exceptionally Warm and Prolonged Flow of Warm Deep Water toward the Filchner‐Ronne Ice Shelf in 2017” (GRL) was highlighted in Science as “Editor’s choice“! The editor gets some of the details wrong – but still, how cool isn’t that? Congratulations Svenja! I’m so proud to be a co-author!

In the highlighted paper we present the latest data from the southern Weddell Sea (including temperature time-series from one of my LoTUS-buoys  that I tell about here), which reveal that 2017 was a special year. The seasonal inflow of warm water that we typically observe to flood the continental shelf during summer was warmer and longer than normal, and we suggest that the anomalous conditions are linked to a fresh anomaly developing upstream as a consequence of high summer sea ice melt. The presented mooring records end early 2018 –  showing that the shelf density then was lower than normal, potentially leaving the “door open” for an earlier than normal onset of next year’s inflow.

Hopefully Polarstern (and I!) make it back to the Weddell Sea this winter (despite Corona) to recover the moorings deployed in 2018, so that we can tell the rest of the story and learn more about the implications of freshwater anomalies.

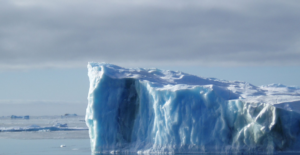
Ice berg in the Weddell Sea Photo: E. Darelius


Directly from the press: Climate trends and deep water renewal in Norwegian fjords!

They tend to be long and deep, they have one or many sills, they are breathtakingly beautiful and they were carved by ice a long time ago*… I’m off course thinking about the Norwegian fjords! My teaching has brought me back into fjord oceanography (I wrote my Master’s about water mass transformation in a fjord on Svalbard), and last summer I had a little hobby-project trying to figure out how climate change would affect the renewal of the deep water in a fjord… and now that hobby-project is about to get published in “Estuarine, Coastal and Shelf Science”!

But let’s start from the beginning! Like I wrote in the first line, a fjord has a sill. The sill closes off the deeper part of the fjord basing from the rest of the ocean, and so water in the deep basin is stagnant, i.e. it is cut off from the rest of the ocean.

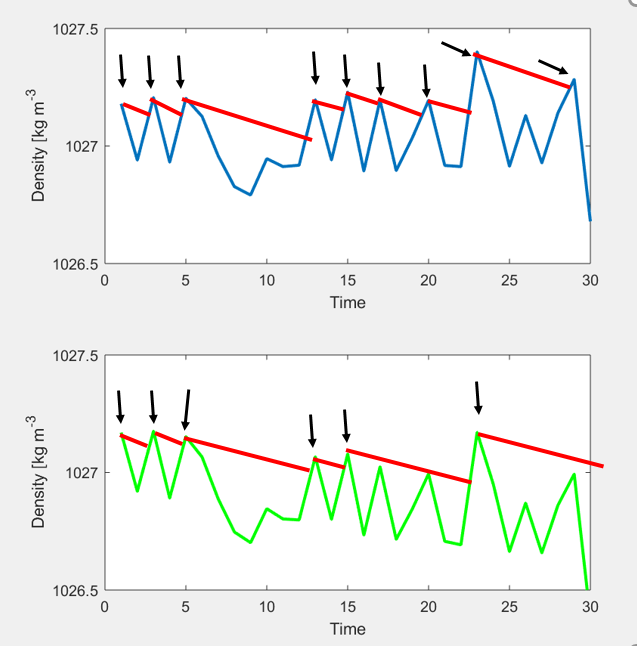
With time, the density of the basin water will decrease (as turbulence causes lighter water from above to be mixed down). The density of the water outside of the sill (at sill level) varies in time – e.g. because of wind blowing along the coast that pushes the dense water down or lifts it up– and at some point the water outside will be dense enough to flow into the fjord and replace the basin water and the basin water is “re-newed”. How often the deep water is renewed varies greatly between fjord systems – in some fjords the deep water would be stagnant only a couple of weeks while it may be many years between two renewals in others.  How long the water stays in the fjord depends mainly on two things: how quickly the density in the fjord decreases (the slope of the red line below) and how variable the density of the coastal waters are (the wiggliness of the blue line). If the density decreases fast, the interval between to renewals will be short, and if the ambient density is very variable, the interval will be longer (on average). If we  have information about the density decrease and the density variability for a particular fjord, then we can estimate how long it will be between two renewals (on average) and say something about the probability for very long stagnation period.

Does that matter? Well, fish and other creatures that lives in the fjord consume the oxygen in the water, and the longer the water stays in the fjord the lower the oxygen concentration gets and the tougher it gets for the animals who live there to breathe. So yes, it matters, so fish (and others that care about the environment in the fjord) would want to know if the likelihood of deep water renewal is changing.

The Institute of Marine Research in Norway have hydrographical stations along the coast, that have been collecting salt and temperature data (from which one can calculate density) every other week (roughly) since the 1930s. The data show that the density typically is highest during spring and summer – and that after around 1990 the densest water is becoming less dense (on six out of eight stations). Superimposed on the ambient density variability, we have a negative trend (green line above). The trend is bad news to, for example, the fish living in the fjord basins, since the decreasing trend will increase the length of the stagnation period (fewer black arrows). In Masfjorden, for example, the statistical framework that I develop in my paper suggest that the fish would have to wait (on average) two years longer for new, oxygen rich water and that the risk of stagnation periods longer than 10 years increase by a factor of six.

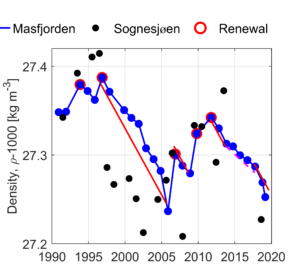
The last deep water renewal** in Masfjorden probably occurred around 2011 (see below), and data from a cruise in June this year show that there has been no renewal so far this year and that oxygen concentrations now are around 2.3 mL/L. Unfortunately, my model cannot predict if there will be a renewal this year, only say something about the probability that the deep water will be renewed.

Read the entire article here!

Density at the bottom of Masfjorden (blue). When the deep water is renewed, the density increase (marked with red circles). From Darelius (2020), Estuarine, Coastal and Shelf Science (Creative common license CC BY 4.0)


* or possibly designed by Slartibartfast?

** There has been partial renewals after 2011, where the upper part of the fjord basin is renewed.


Hipp Hipp Hurray!

Corona is turning our lives up side down – but that’s no reason not to stand up and sing “Happy Birthday” to Prof. Emiritus Arne Foldvik who turns 90 years old today! (Those of you who read Norwegian can read about him here)

Arne started out his scientific carrier as a meteorologist, studying among other things the waves that are generated when wind blows over topography  (he did that using the long tank down in the basement of GFI where I’ve taken my students to play with Nansen’s dead water) – but he later turned to oceanography.  Around the time when I was born he led his first Norwegian oceanographic expedition to Antarctica and the southern Weddell Sea. During that expedition he found what the Americans had failed to find a few years later: The Filchner overflow, an enormous* under water river that carries cold and dense water from the Filchner-Ronne ice shelf cavity to the bottom of the Weddell Sea. This discovery is one of the reasons I’m working with polar oceanography today, as I spent the three years of my PhD revisiting the exciting data that Arne & co had collected in the outflow.

The last time Arne came by my office, we chatted about towed icebergs, melting ice and the experiment I did in my “Nansen’s memorial lecture” (which Arne attended). Arne has been involved in projects where the aim has been to tow icebergs from Antarctica to dry areas in demand of freshwater (originally the middle east, and just a few years ago, to South Africa ). Arne told me, that if one did that, one would get ice into water warm enough, that the results of my experiments would no longer hold.

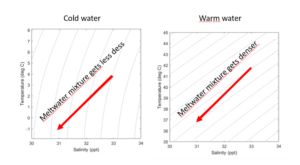
The density of seawater is a non-linear function of temperature and salinity, and while salinity dictates the density for cold water (causing the lines of constant density to be almost vertical in the TS-diagram below), temperature is more important for warm water (causing the lines of constant density to tilt more). So, that means that while the (fresher and colder) melt water mixture is lighter than the ambient water if it is cold, it will actually be denser if the ambient water is warm enough! Off course we had to try this out – I never got around to doing so, but yesterday, Mirjam finally did!

Somewhat disappointing – we realized that the result is more or less the same, independent of the water temperature. Does that mean the physics (and Arne) are wrong??? Probably not, it probably just means that the molecular diffusion of heat is acting fast enough that the “cold” melt water mixture doesn’t stay cold enough to sink 🙁

Anyway, here’s a stratified toast to Arne Foldvik!  HAPPY BIRTHDAY!

Temperature-Salinty diagram for cold and warm water. The dashed lines are lines of constant density (increasing density to the right) and the red line is a “Gade line”, which shows how temperature and salinity decrease as ice melts in seawater.


* 1.6 million cubic meters per second – that is almost ten times the Amazon river