Kjersti, Steffi, Elin and myself (Mirjam) recently discussed ways to better integrate the GEOF105 student cruise into the course. My suggestion was to ask the students to observe things throughout the whole duration of the course, and then have them relate their time series with what they observe when “at sea”. In this mini series tagged #BergenWaveWatching, I write up a couple of suggestions I have for observations that are easy and fun to make. I am anticipating that my suggestions will be strongly biased towards #wavewatching, so if you have any other suggestions, I am all ears! 🙂
Where to go
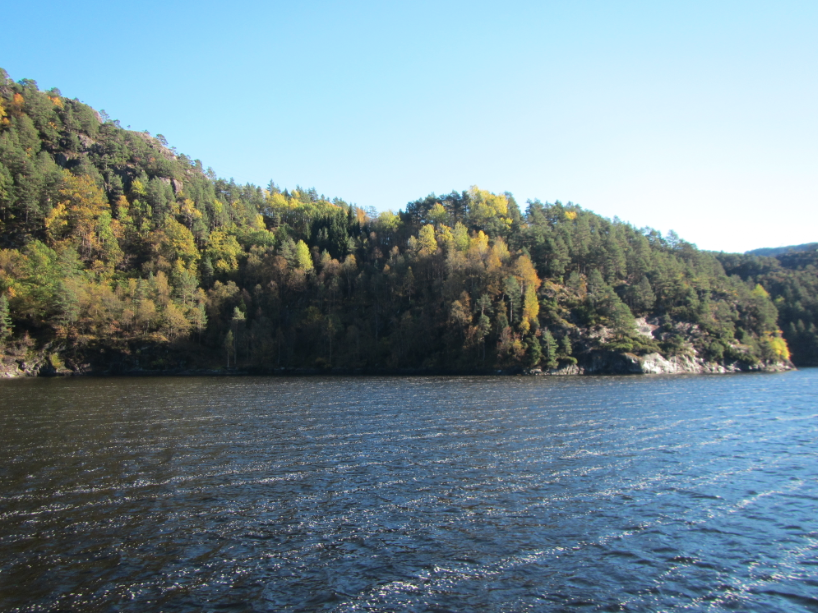
Anywhere where you can look out over water, for example Fjellveien (where the picture above was taken from) or Fløyen
When to go
Any time
What to look out for
Pattern on the water. Can you see wakes? Langmuir circulation? Gusts of wind? Areas that are sheltered from the wind?
Langmuir circulation in Østerfjorden, described here.
What to do with the data
Observe closely and try to make sense of it by relating it to, for example, ships, weather at that time, …
Do you have suggestions for us? What other spots or topics would you recommend in and around Bergen to be added to the #BergenWaveWatching list? Please leave a comment! We are always looking to expand this list!
Kjersti, Steffi, Elin and myself (Mirjam) recently discussed ways to better integrate the GEOF105 student cruise into the course. My suggestion was to ask the students to observe things throughout the whole duration of the course, and then have them relate their time series with what they observe when “at sea”. In this mini series tagged #BergenWaveWatching, I write up a couple of suggestions I have for observations that are easy and fun to make. I am anticipating that my suggestions will be strongly biased towards #wavewatching, so if you have any other suggestions, I am all ears! 🙂
Where to go
Bergen Harbour
When to go
Any time you might have to run errands around there anyway
What to look out for
So many things! Here are a couple of examples:
Waves. What direction are they coming from? What causes them?
Wakes, as a special form of waves. Which ship/animal did they originate from?
Reflections of waves on the straight walls of the harbour basin (like I did here)
Tides
Water levels in general
What to do with the data
Describe and try to make sense of it by relating it to other variables like wind speed and direction, atmospheric pressure, tides, shape of the boundaries, ships, etc, like I did for example here.
Do you have suggestions for us? What other spots or topics would you recommend in and around Bergen to be added to the #BergenWaveWatching list? Please leave a comment! We are always looking to expand this list!
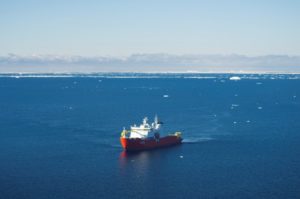
The first mooring was successfully recovered yesterday (hipp hurray!) by @cisprague & co onboard Araon – but then Araon had to steam towards the Ross Sea to help a fishing boat that sent out SOS – alarm. Finger’s crossed for a happy ending – and a quick return to science.
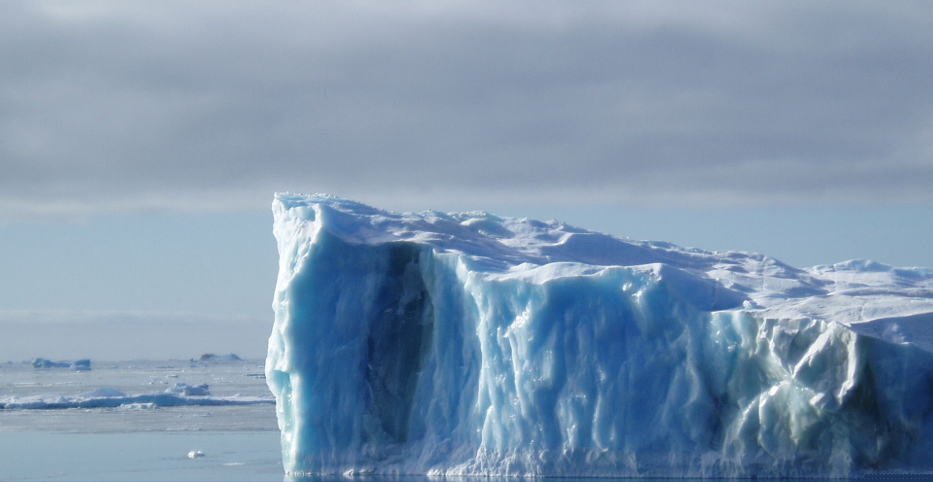
Araon is steaming south for a new expedition to the Amundsen Sea and it’s now out of range on marinetraffic.com (unless you pay) … but @cisprague (Christopher Iliffe Sprague – one of two Swedish students on board who will hopefully recover the moorings Karen & co deployed two years ago) is still on Twitter so internet connections onboard must have improved since I was onboard in 2016… the icebergs look the same, though!
Have a happy cruise – and good luck with recoveries & science!
Kjersti, Steffi, Elin and myself (Mirjam) recently discussed ways to better integrate the GEOF105 student cruise into the course. My suggestion was to ask the students to observe things throughout the whole duration of the course, and then have them relate their time series with what they observe when “at sea”. In this mini series tagged #BergenWaveWatching, I write up a couple of suggestions I have for observations that are easy and fun to make. I am anticipating that my suggestions will be strongly biased towards #wavewatching, so if you have any other suggestions, I am all ears! 🙂
Where to go
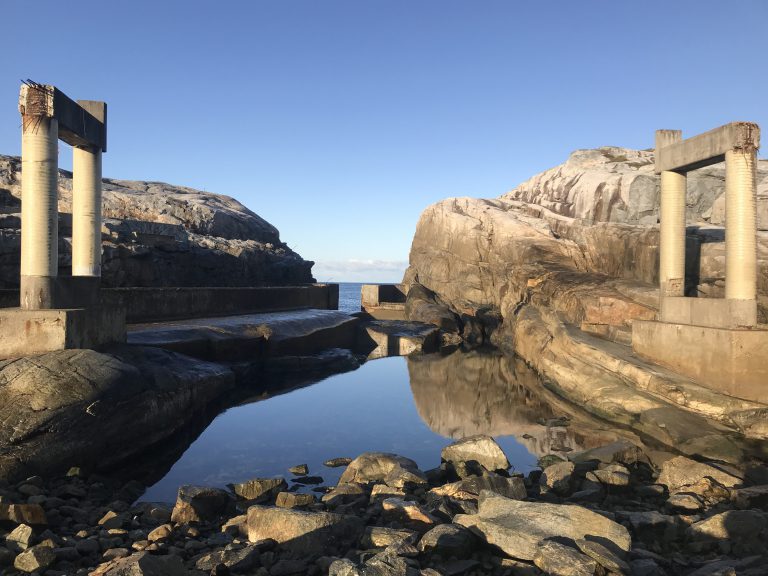
Bølgekraftverket in Øygården
When to go
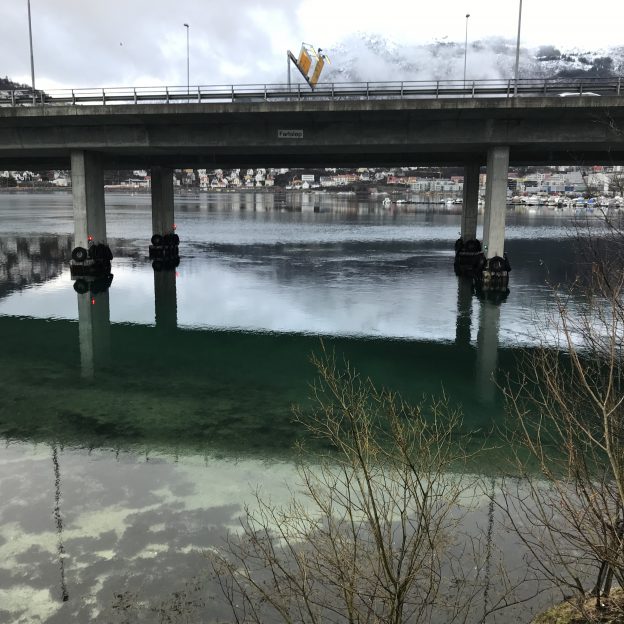
Until recently I would have said that it doesn’t really matter when you are going, because whenever I had been there I got to see things like this:
But then I went there and there were absolutely no waves to be seen, which I think was a combination of a calm day with hardly any wind, no swell coming in either, and very low water levels, possibly tides and in general. So I would recommend going there when there is wind and also the water levels aren’t super low so any potential waves actually have the chance to make it into the area of the wave power plant.
Unusually calm day at the wave power plant. See the pillars that used to carry a bridge across here?
A one-off visit on a wavy day should give you plenty of things to discover and think about, but you might get addicted and come back again 😉
What to look out for
There are at least two parts of the wave power plant where you can clearly recognize how they were supposed to work when they were still in operation. A wave power plant where waves used to drive a turbine, and another one where waves run up a funnel to fill a reservoir. But in general it’s a pretty awesome wave watching spots with some rocks that are usually just below or at water level, steep cliffs, areas that are exposed to the open ocean while others are sheltered from the waves and wind. So much to explore!
What to do with the data
“Data” here means your pics and movies of the waves.
I find it super interesting to just describe the observations of the waves around the island and wave power plant, and it might keep you busy for a while (see for example the two blog posts I linked to in the paragraph above). But you could of course also look into wave conditions in this spot. What does the wave forecast say for the day you are visiting? How do the wave conditions on that day compare to the average conditions? Or the day when the power plant got destroyed? Or the most recent extreme events? How often do extreme events occur? And what conditions actually make an event “extreme” in this place?
How this is relevant for the student cruise
Understanding waves and their enormous forces is relevant for anyone who wants to work with ocean observations or any kind of structures in the ocean. This is the ideal spot to become aware of how fragile any human structure is when confronted with the forces of nature. Also looking at wave fields more closely, both in observations and in models, is a great way to connect to what’s really going on in the ocean.
Do you have suggestions for us? What other spots or topics would you recommend in and around Bergen to be added to the #BergenWaveWatching list? Please leave a comment! We are always looking to expand this list!
Kjersti, Steffi, Elin and myself (Mirjam) recently discussed ways to better integrate the GEOF105 student cruise into the course. My suggestion was to ask the students to observe things throughout the whole duration of the course, and then have them relate their time series with what they observe when “at sea”. In this mini series tagged #BergenWaveWatching, I write up a couple of suggestions I have for observations that are easy and fun to make. I am anticipating that my suggestions will be strongly biased towards #wavewatching, so if you have any other suggestions, I am all ears! 🙂
Where to go
Pretty much anywhere you like / need to go to anyway
When to go
When it’s raining
What to look out for
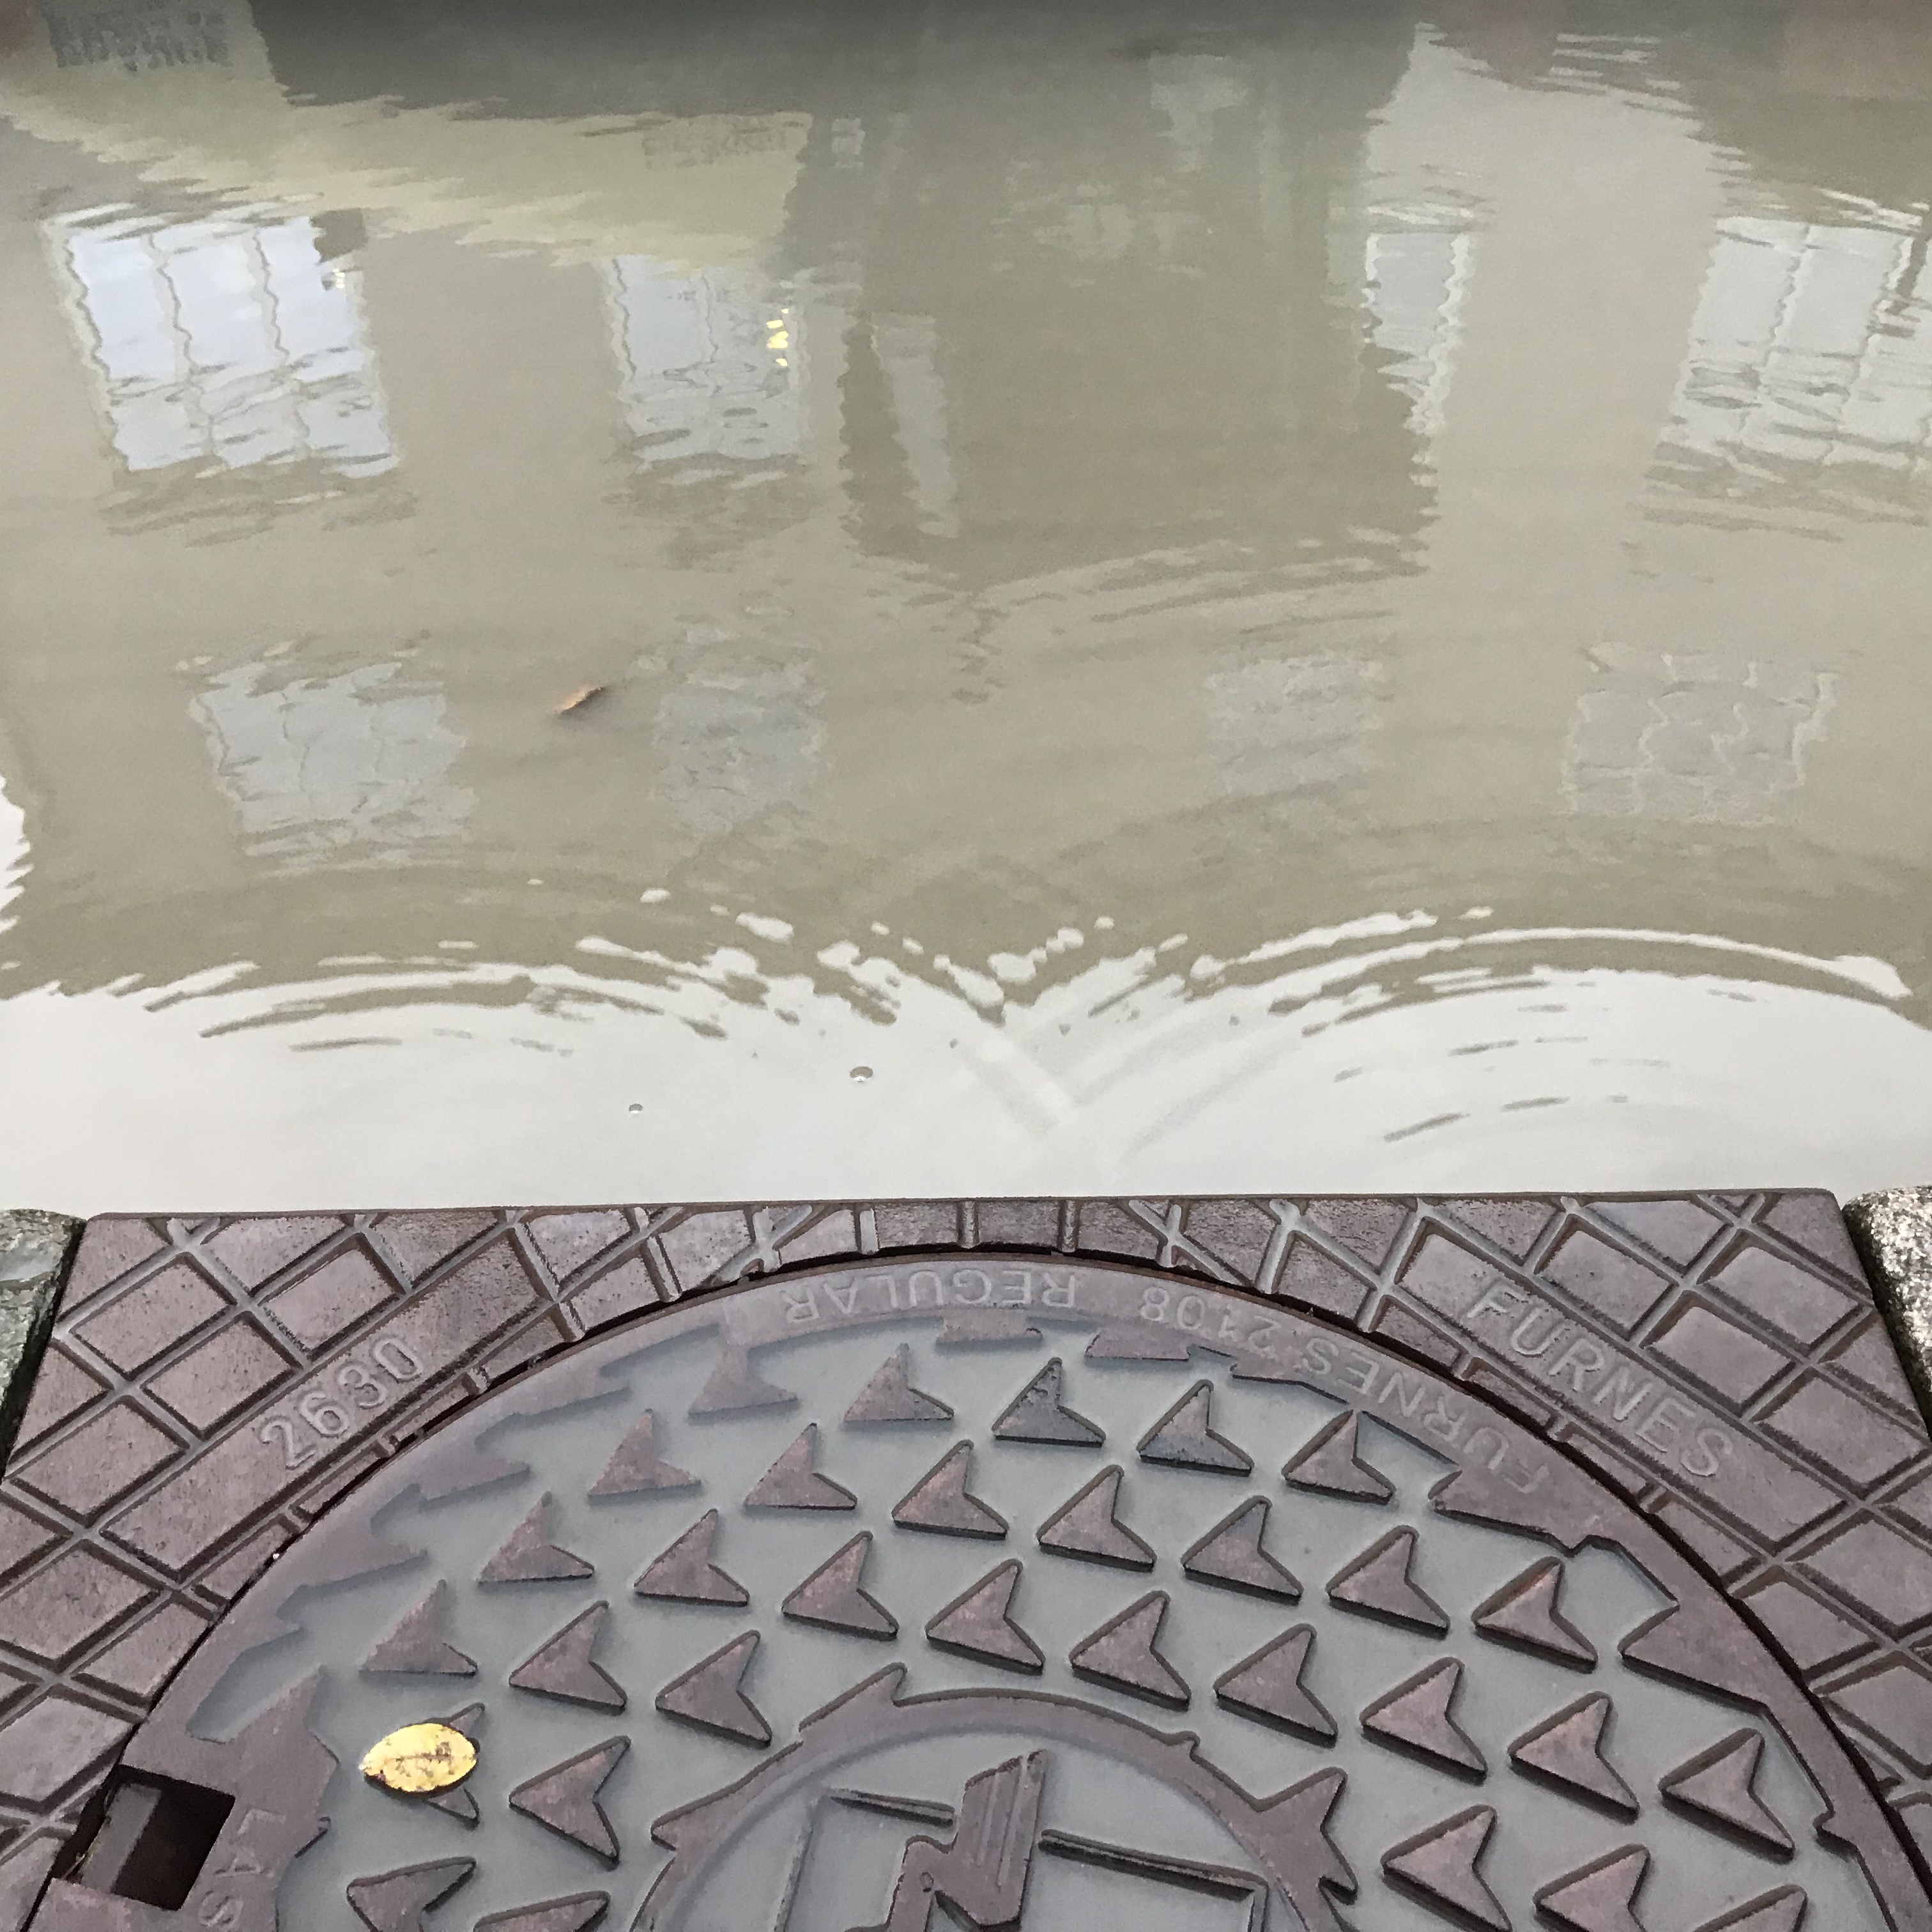
Pattern in puddles, gutters, storm drains. Because there is so much more to them than just being the means of getting rid of water or annoyances where water has accumulated! For example, check out the roll waves in the picture above and my blog post on those.
Or the picture below. What’s going on there? Solution to this wave riddle here.
Waves on a puddle on a street in Bergen. Picture from this blog post.
What to do with the data
Collect, describe, become more aware of what is happening everywhere around you.
How this is relevant for the student cruise
Not directly, it’s about forming the habit of looking at the world through the eyes of someone who’s interested in waves, which can then lead into the habit of looking at the world with a focus on anything you are specifically interested in.
Do you have suggestions for us? What other spots or topics would you recommend in and around Bergen to be added to the #BergenWaveWatching list? Please leave a comment! We are always looking to expand this list!
Kjersti, Steffi, Elin and myself (Mirjam) recently discussed ways to better integrate the GEOF105 student cruise into the course. My suggestion was to ask the students to observe things throughout the whole duration of the course, and then have them relate their time series with what they observe when “at sea”. In this mini series tagged #BergenWaveWatching, I write up a couple of suggestions I have for observations that are easy and fun to make. I am anticipating that my suggestions will be strongly biased towards #wavewatching, so if you have any other suggestions, I am all ears! 🙂
Today we have another really accessible spot in Bergen that is super well suited for wave watching!
Where to go
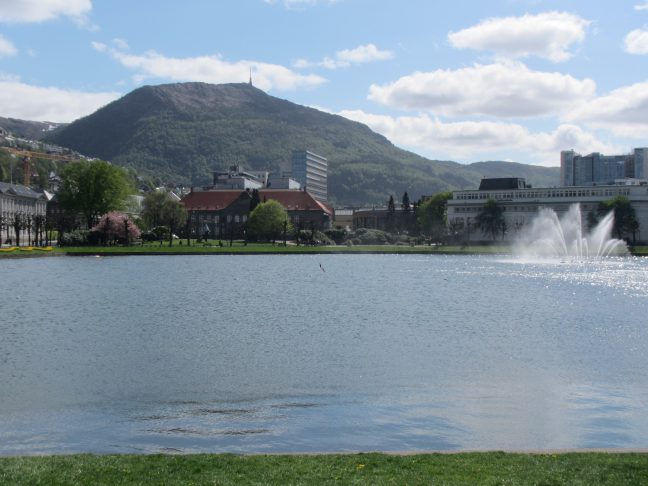
Lille Lungegårdsvannet in Bergen city center
When to go
Whenever you happen to walk past there anyway
What to look out for
Suggestion 1: Waves and wind direction. The latter is very easy to observe from the fountain. And Lille Lungegårdsvannet is amazing for wave watching because you can walk all the way around and see waves from all sides!
Looking at Lille Lungegårdsvannet with the wind. Waves only appear at a distance from the shore in the foreground, because the water is sheltered from the wind by the shore. Blog post on this here.
Suggestion 2: wave reflection. Due to the geometric shape of Lille Lungegårdsvannet with all the straight edges all around, wave reflection can lead to really cool pattern! Can you relate what’s going on to the wind direction?
What to do with the data
Depending on how often you go, you can either relate the wave field to the wind direction and strength (both your own estimates and what the weather forecast says about those). Or you can describe a single situation like I did for example here.
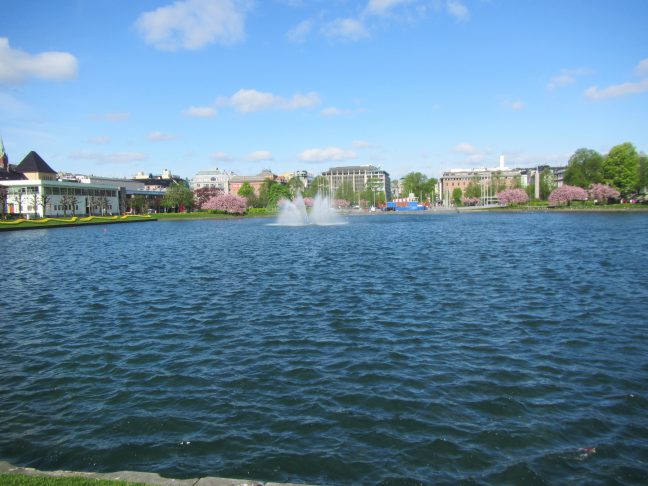
Looking across Lille Lungegårdsvannet into the wind. See how the waves are now a lot taller than in the picture above? Blog post on this here.
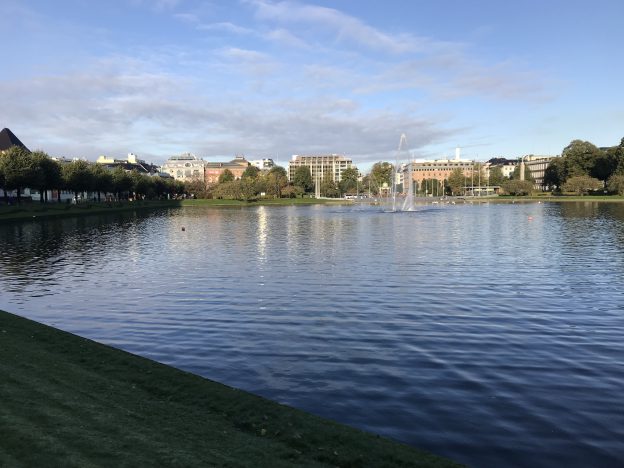
The geometric shape of Lille Lungegårdsvannet leads to pretty reflections! Picture from this post
How this is relevant for the student cruise
Understanding waves is very relevant for anyone being on the water. Whether you are riding off a storm, deploying instrumentation or trying to keep the boat as steady as possible for sensitive work, being able to read the waves is key.
Also, connecting observations of conditions at land and sea to wind speeds is how the Beaufort scale was originally defined. Of course, you won’t see a fully developed wave field on a body of water as small as Lille Lungegårdsvannet, but it’s a good first step to observe differences.
Do you have suggestions for us? What other spots or topics would you recommend in and around Bergen to be added to the #BergenWaveWatching list? Please leave a comment! We are always looking to expand this list!
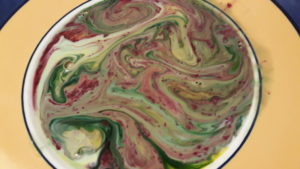
Not much polar oceanography in this post… but a lot of colors, physics (or is it chemistry?) and most importantly, a lot of fun! so I thought I’d share the results of me and my daughters playing in the kitchen a few evenings ago. (not much homework this week!)
Guess what will happen? (you’ll find the answer at the bottom of the post)
Milk, food coloring and a bit of soap was supposed to create a firework of colors… didn’t work out (the dye just sank when we added the soap) but it got pretty anyway!
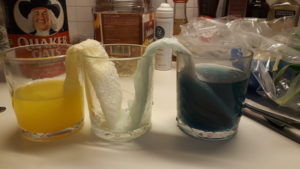
DIY-lava lamp! Sunflower oil, food coloring, water and some aspirin make the trick!
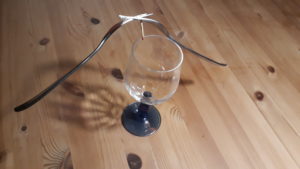
Impressive equilibrium… much easier than it seems! We even managed to put the match on fire!
Toothpaste for elephants? Didn’t know where to get hold on H202 stronger than 3% (which I found at the pharmacy) so our toothpaste was nothing like the crazy ones we saw on youtube… but definitely the children’s favorite!
Then come and join us! We are currently have one PhD position at the University of Bergen (apply here*, deadline 10/1, 4 years) and one position at the Norwegian Polar Institute in Tromsø (apply here, deadline 7/1, 3 years) open. Both candidates will work on processes related to oceanic heat transport and melting ice shelves in the Weddell Sea, Antarctica – an exciting topic! If you’ve got questions about the positions, then don’t hesitate to contact me!
*The position in Bergen is announced only in Norwegian since it includes 25% duty work related to the project “EkteData” which aims to increase the interest for math and science among high school students. The candidate must therefor speak a Scandinavian language.
Kjersti, Steffi, Elin and myself (Mirjam) recently discussed ways to better integrate the GEOF105 student cruise into the course. My suggestion was to ask the students to observe things throughout the whole duration of the course, and then have them relate their time series with what they observe when “at sea”. In this mini series tagged #BergenWaveWatching, I write up a couple of suggestions I have for observations that are easy and fun to make. I am anticipating that my suggestions will be strongly biased towards #wavewatching, so if you have any other suggestions, I am all ears! 🙂
Really close to home today! Nygårdsbruen.
Where to go
Nygårdsbruen — the bridge right next to GFI
When to go
Whenever you are going to or leaving GFI anyway works fine, especially if that happens to be at around the same time every day
What to look out for
That kind of depends on how regularly you will realistically be able to go there. If you are there several times per week, you could look at the tidal current. Which direction is it going in, how strong is it, what’s the water level like, …?
If you aren’t going as often, maybe focus more on a general description of what is going on. Is there a tidal current visible? Is it going in or out? Does it have an influence on the wave field? What other factors influence the wave field? What’s the wind direction? Can you see areas that are sheltered from the wind and areas where the wave field is more developed? Can you easily look into the water? Where, and where not? Why is that? That kind of stuff.
The current acts as a barrier to wind-generated waves. How cool is that? Blog post on this here.
What to do with the data
By “data”, I mean the collection of pictures on your smartphone. You could, for example, relate them (thanks to the phone’s time stamp on the pictures) to time before/after high water as I did in this post for tides on the Elbe river in Germany. This of course doesn’t account for the spring/neap signal, which you might want to include.
Questions that I find interesting: When is the strongest current actually happening relative to high water, and within the spring/neap cycle? In what way do ingoing and outgoing currents differ (and why? Shape of the landscape? Different gradients in the water level? …)?
Or, if you don’t have a lot of data from different days, describe what you see (maybe similarly to what I did here).
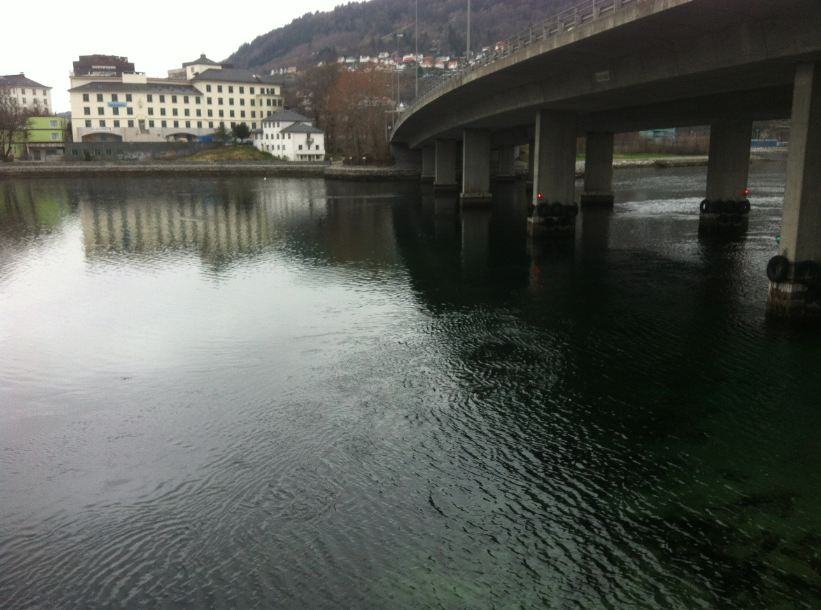
Looking towards Storelungeren. See there are at least four different areas of what you see on the water? (Being able to look into it clearly, being able to look into it where shaded by the bridge, reflection of the other shore, rough surface due to wind waves)
How this is relevant for the student cruise
One task on the GEOF105 student cruise is relating trajectories of drifters to several factors. The wind field on that day, for example, but also the tidal currents in byfjorden. So having a good intuitive understanding of tides makes interpreting the drifters’ trajectories a lot easier, even though the drifters will be deployed in a different area.
More generally, this suggestion is about repeatedly observing a very easily accessible body of water and looking at how it looks different each time. This is good practice of observational skills, and also eye-opening to the many ways in which a body of water can look different at different times — different times in the tidal cycle, different seasons, different weather, especially different winds.
Do you have suggestions for us? What other spots or topics would you recommend in and around Bergen to be added to the #BergenWaveWatching list? Please leave a comment! We are always looking to expand this list!