Uppgifter: Riggar och tidsserier

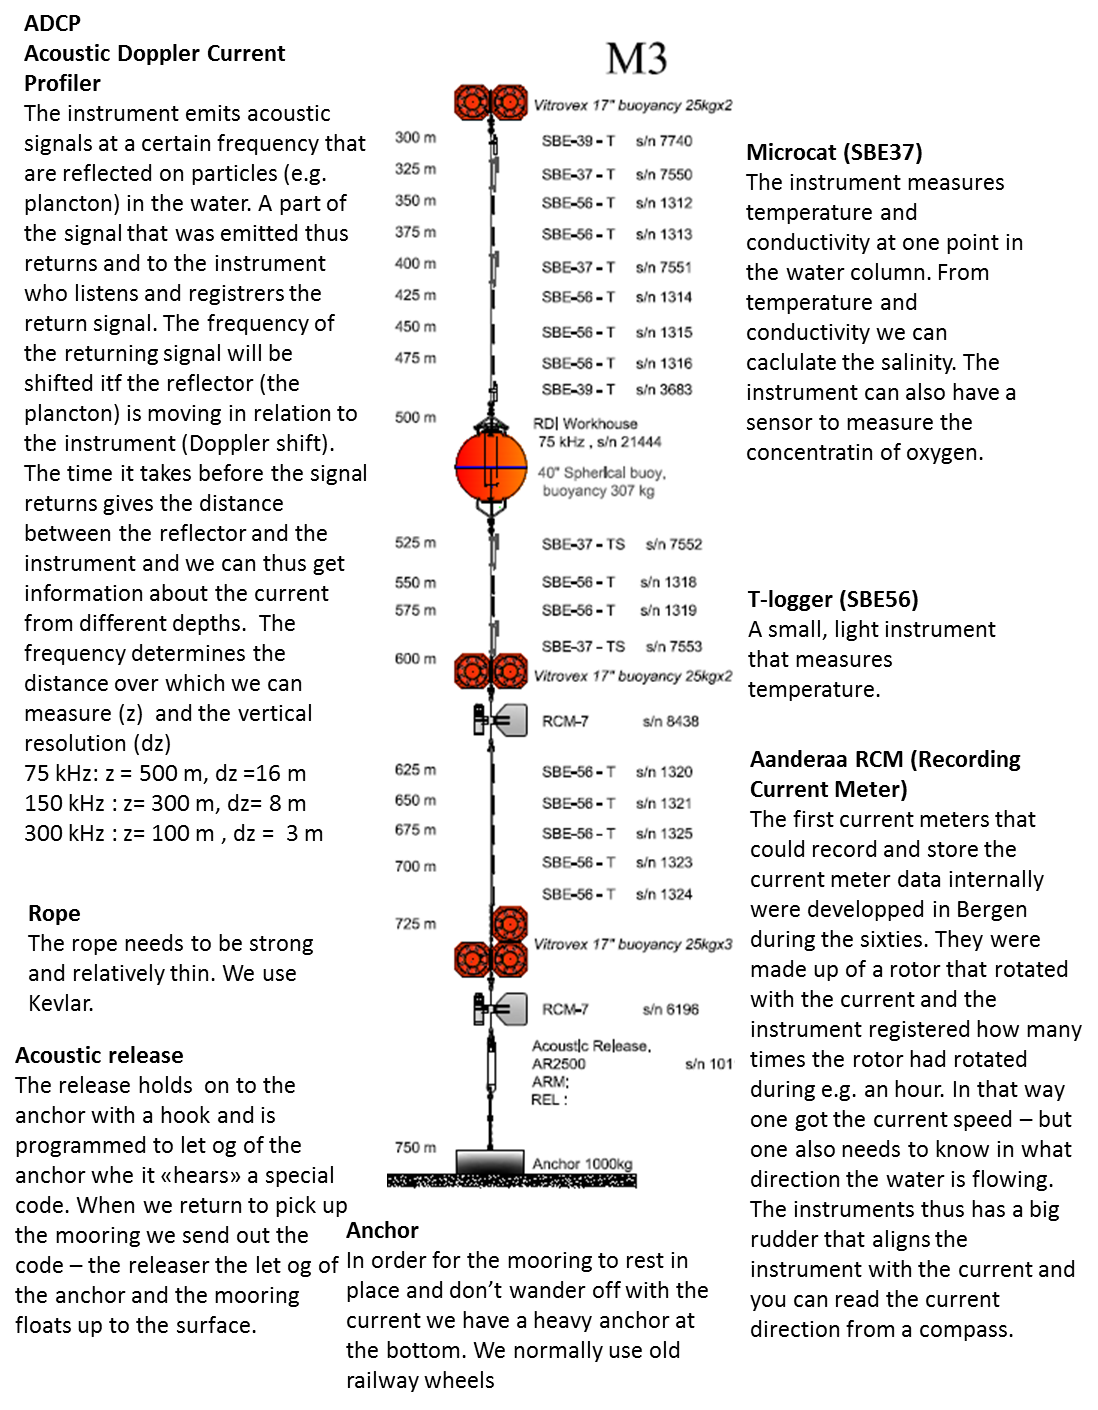
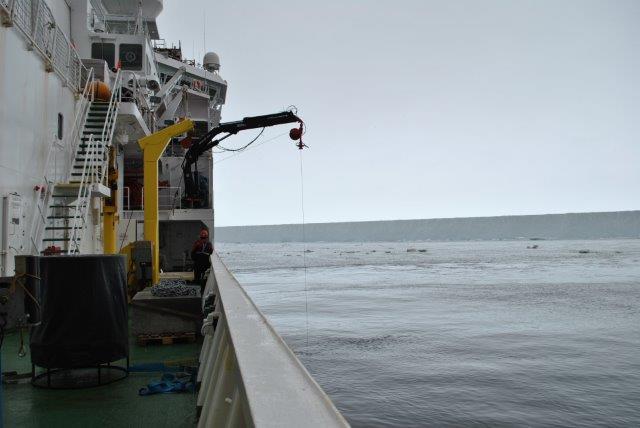
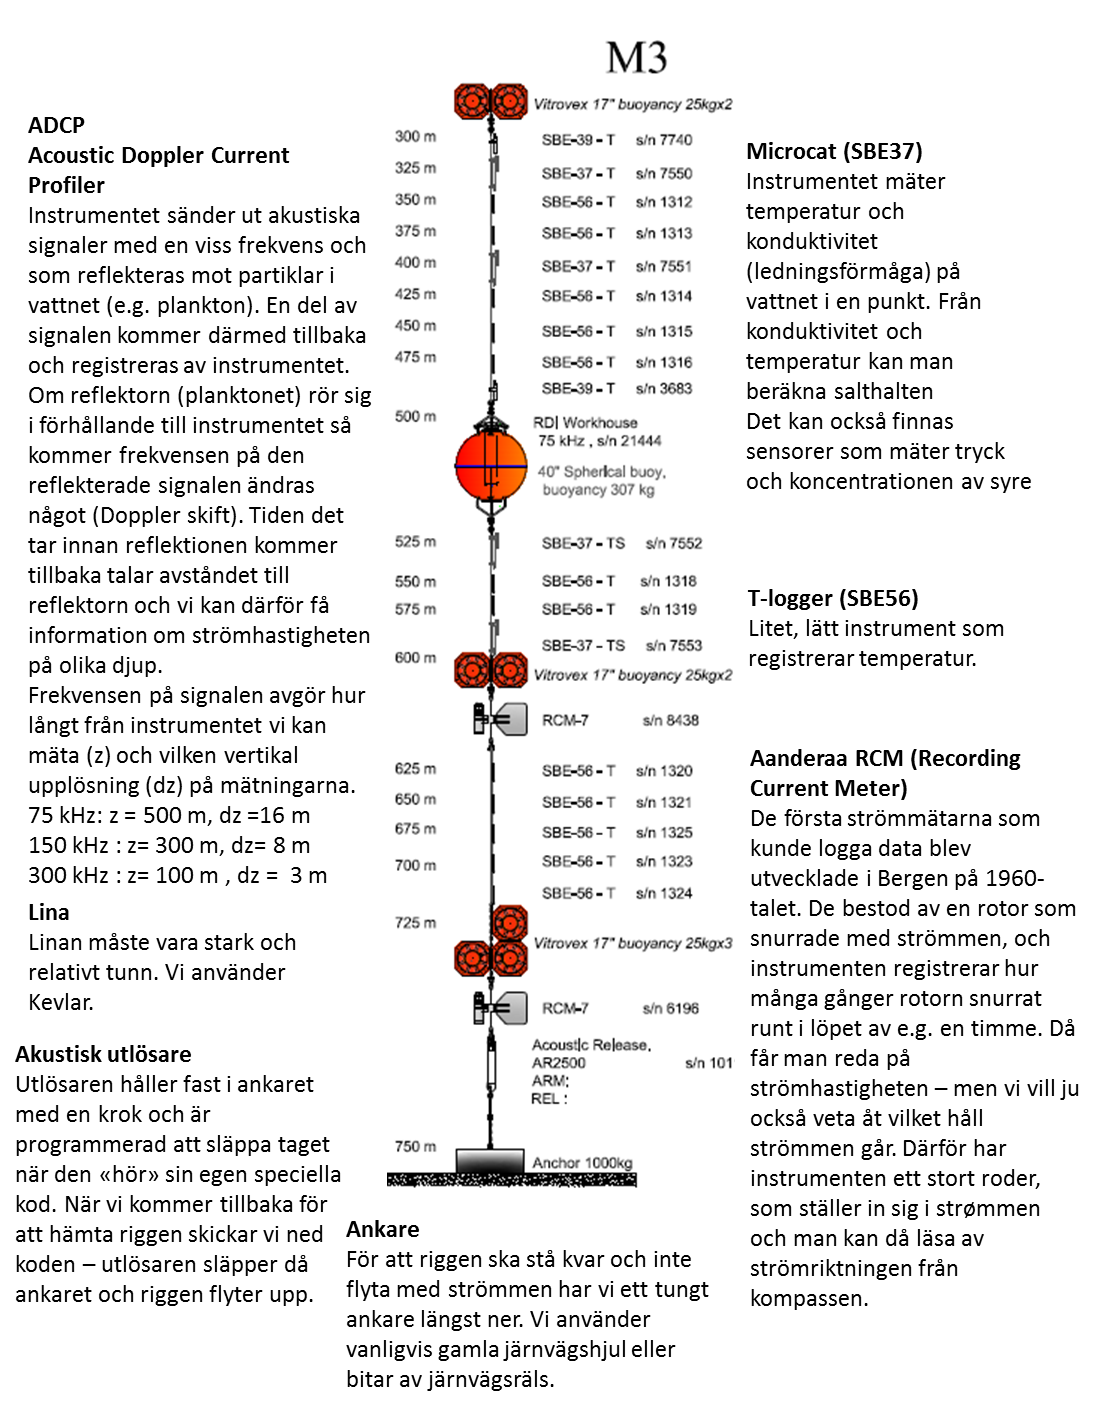
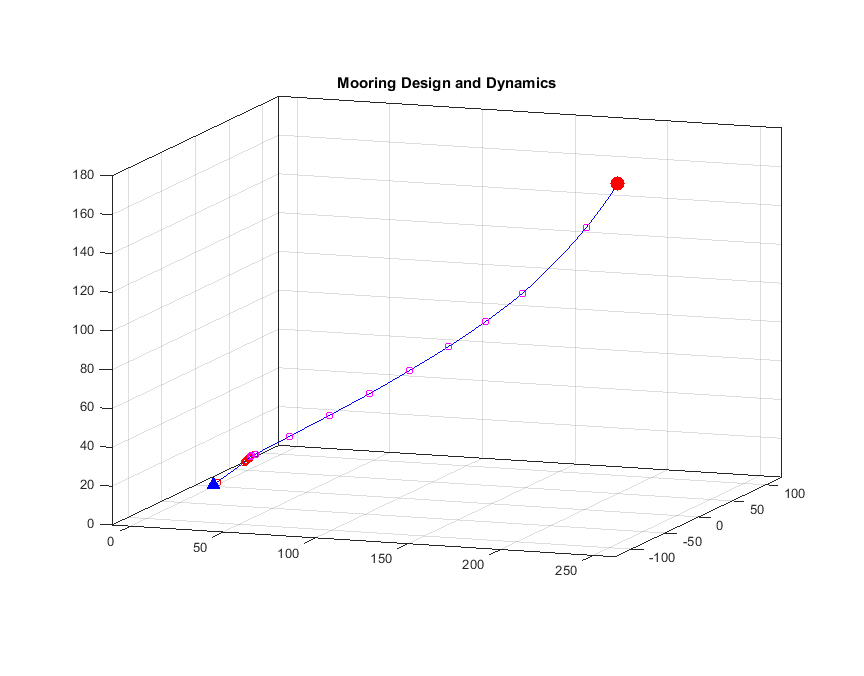
Vi reser på tokt till Amundsenhavet vartannat år då gör vi en massa mätningar och får en bild av vad som händer just då, när vi är där. Men vi vill ju såklart också veta vad som händer när vi inte är där. Därför sätter vi ut “riggar”. Riggar är kort och gott ett ankare, en lina som vi sätter fast instrumenter på och så flytelementer som håller den uppe. Riggen får stå kvar på botten och mäta (vanligtvis ström, salt och temperatur men jag ska också ha instrumenter som mäter koncentrationen av syre i vattnet) tills vi kommer tillbaka ett år eller två senare för att hämta upp den. Hur riggen ser ut och vilka instrumenter man sätter på den beror så klart på vad man ska studera! I tabellen i uppgift 2 ser du några av instrumenten vi använder och her ser du hur en av mina riggar ska se ut:

rigg

Uppgift 1

Nu kan du få designa din! Hur skulle din rigg sett ut om du vill

  1. studera hur vattnets salthalt och temperatur förändrar sig i de övre 200 m under ett år i ett område som är 500 m djupt?
  2. studera en bottenström som når upp till 300 m över botten?
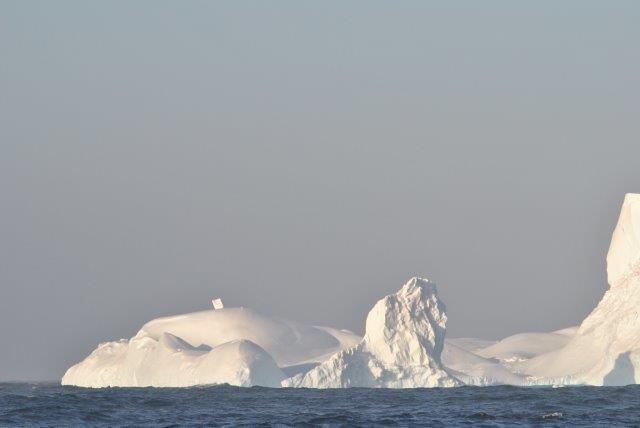
  3. ta reda på hur mycket varmt vatten som strömmar in under in shelfis? Det är 800 m djupt. Tänk på att isbergen kan nå ner till 300 m djup!


Uppgift 2

Gör beräkningarna för din egen rigg eller för en rigg som har:

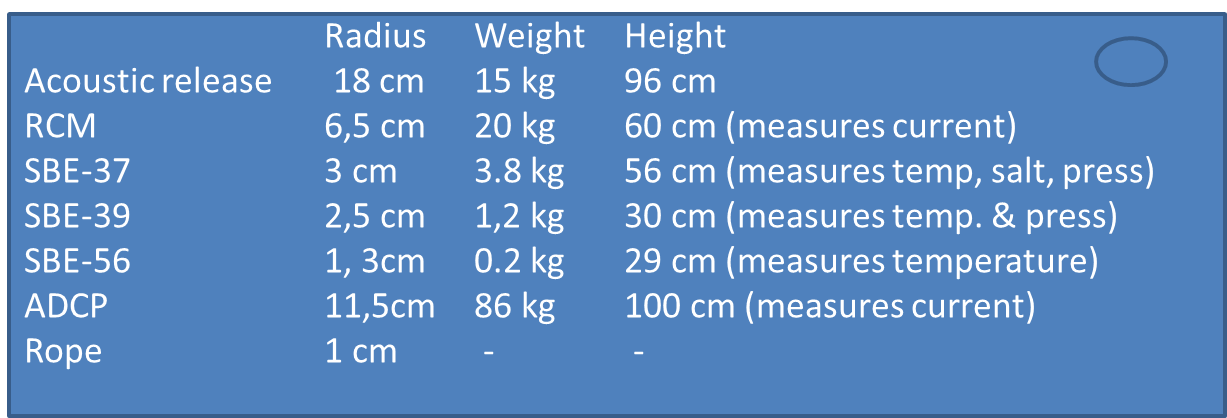
1 x Utlösare (25 möb); 3 x  SBE37 (25, 150 och 300 möb), 1 x RCM (50 möb), 1 x ADCP (300 möb) och  5 x SBE56 (50, 75, 100, 200, 250 möb). Möb=meter över botten.

Instrumenterna har följande dimensioner (alla har omtrent sylinderform):

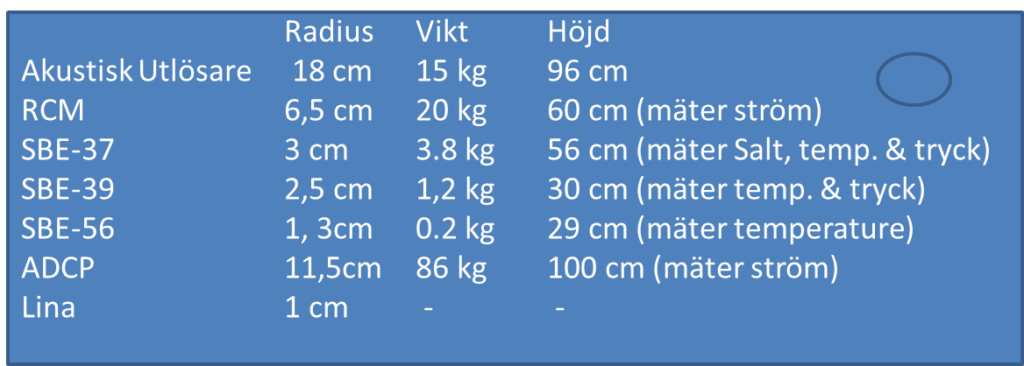
a) Hur mycket väger instrumenterna på riggen i luft? i vatten?

Riggen måste också ha flytelementer (glaskulor) för att stå vertikalt!

b) Hur stor är uppdriften från en glaskula? Glaskulornas diameter är 43 cm och de väger 22 kg (i luft).

c) Hur många glaskulor behöver vi för att hålla riggen uppe?

Uppgift 3

När det är stark ström så dras riggen ner mot botten – det är inte bra. För det första får man inte mätningar från de djup man hade tänkt och för det andra så kan många instrument inte mäta när de lutar för mycket. En ADCP kan till exempel inte mäta strömmen om den lutar mer än 15\(^\circ\). Därför sätter vi på extra flytelementer för att hålla riggen upprätt också när det är stark ström. Kraften som det strömmande vattnet utövar på riggen är proportional mot arean som vattnet träffar.

a) Hur stor andel av riggens “area” utgör linan?

b) Hur mycket minskar motståndet om vi bytar till en lina som bara är 6 mm i diameter?

c) Ett instrument har dragits ned till 170 m över botten (möb) och dragits 218 meter nedströms, ett annat instrument har dragits ned till 65 mab och dragits 105 meter nedströms. Formen på linan kan beskrivas med en (halv) parabel. Finn uttrycket för parabeln!

d) Trycksensorn på en ADCP visar att den nu sitter 40 m över botten. Hur mycket lutar den då? Kan vi använda mätningarna?

e) Hur högt upp måste ADCP ha suttit för att vi skulle kunnat använda mätningarna?

f) Varför tror du vi hellre sätter en ADCP högt uppe så att den tittar ner, hellre än att den sitter närma botten och tittar upp?

mooring2
En av mina riggar i stark ström. Vi använder datorprogram för att räkna ut hur riggarna kommer uppföra sig i starkt ström. Programmet talar också om till exempel hur tungt ankaret måste vara!


Uppgift 4

När vi hämtar upp riggen igen och lastar ner datan från instrumenterna så får vi tidserier av ström, temperatur och salthalt. Nu ska vi titta på data från riggar som stod ute i Amundsenhavet 2012.

a) Läs in och plotta strömmätningarna från rigg S4 i 17-24 juni, 2012. (Riggdata_S4_1).  Strömmätningarna är i cm/s. Vad är det vi ser?

b) Hur stor är medelströmmen? i vilken riktning går den? (\(u\) ger strömstyrkan i \(x\)-riktning (mot öst) och \(v\) ger strömmen i \(y\)-riktning (mot norr))

c) Om du ska tillpassa eller beskriva observationerna med en funktion, vilken väljer du då?

d) Bestäm konstanterna med hjälp av regression.

e) Ett isberg flyter med strömmen i närheten av S4 – sätt upp ett uttryck (på vektorform) för hur isberget kommer att förflytta sig och plotta trajektorien i en ny figur. Beskriv rörelsen!

f) Plotta strömmen en vecka fram i tiden med hjälp av din funktion från (d).

g) Läs in datan från S4 24/6 – 1/7 och plotta den i samma figur – stämmer din model? Varför/varför inte? (Filen heter: Riggdata_S4_2)

Uppgift 5

Läs in och plotta tryckmätningarna från rigg C2. Här var strömmen mycket starkare än vad vi trodde, och vi hade inte satt på tillräckligt med flytelementer 🙁 (Filen heter: Riggdata_C2)

a) Vad är det vi ser? (hint: se uppgift 2)

b) Hur djupt sitter instrumentet när det är svag ström? (1 m \(\approx\) 1 dbar)

c) Hur djupt dras det ned maximalt?

d) Hur stor del av tiden har det dragits ner mer än 40 m? 80 m?

e) \(u\) ger strömstyrkan i \(x\)-riktning (mot öst) och \(v\) ger strömmen i \(y\)-riktning (mot norr). Använd Pythagoras sats och sätt upp ett uttryck för strömstyrkan. Räkna så ut den! Hur stark är den starkaste strömmen? medelströmmen? Hur många kilometer/timme är det?

f) Är det något samband mellan strömstyrka och tryck (dv neddragning)? Hur ser det ut? Beskriv sambandet matematiskt och förklara med ord!


Uppgift 6

Instrumenten går på batteri – och varje gång de gör en mätning går det åt lite (eller mycket om det är en ADCP) energi. Vi vill såklart att instrumenten ska göra mätningar helt tills vi kommer tillbaka och hämtar dem – så vi räknar i förväg ut hur ofta vi kan göra mätningarna utan att batteriet tar slut. Men vi måste också ta hänsyn till e.g. tidvatten när vi bestämmer hur ofta vi ska mäta.

a)Det dagliga tidvattnet (en av komponenterna) har en period på 25.8h. Tidvattnet kan beskrivas med en sinus kurva. Amplituden (och fasen) beror på var vi är – men anta att  amplituden är 10 cm/s och fasen 0. Sätt upp ett uttryck som beskriver tidvattnet och plotta det trettio dagar fram i tiden.

b) Om vi gjort mätningar bara en gång om dagen (i.e. var 24 h), hur hade vår tidserie sett ut då?

c) Vilken period har «svängningen» som vi då observerat?

d)Tidvattnet som vi observerar är en summa av många tidvattenskomponenter med olika perioder. En annan heldaglig tidvattenskomponent har en period på 23.93h.  Sätt upp uttrycket för den tidvattenskomponenten om amplituden är 9 cm/s (fasen kan du sätta till noll) och plotta summan av de två komponenterna. Vad är det du ser? Hur ändras amplituden? Hur långt är det mellan två «amplitudmaximum»? Kan du förklara vad som sker? (tips – plotta både de enskilda komponenterna och summan av dem). Jämför resultatet med dina resultat från uppgift 3g!


Exercise: Moorings and time series


We go on scientific expeditions to the Amundsen Sea every other year or so, and then we do a lot of measurements and learn what things are like right then, when we are there. But we’d off course want to know also what happens when we are not around. To do so we deploy “moorings”. A mooring is and anchor, a line on which we attach instruments and floating elements to keep it upright in the water. The moorings are standing on the bottom and measures (normally currents, salinity and temperature but I’ll also have sensors to measure the concentration of oxygen) until we return a year or two later. What the mooring looks like and what instrument we put on it will depend on what we want to measure. At the bottom of the page there is a drawing of one of my moorings!

ENG_Rig_table

Exercise 1

Now you can design you mooring! What would it look like if you’d want to:

a) Study the evolution (salinity and temperature) of the surface layer (let’s say the upper 200 m) over a year in a area where the water is 500 m deep?

b) Study a bottom current that extends 300 m above the bottom

c) Find out how much warm water is entering the cavity below an ice shelf. The depth is 800 m and the draft of the ice shelf is 300 m deep (which means that ice bergs can reach just as deep!!)


Exercise 2

Do the following calculations for you mooring from above or for a mooring which has

1 x acoustic release (25 mab); 3 X SBE37 (25, 150 and 300 mab), 1 x RCM (50 mab) 1 x ADCP (300 mab) and 5 x SBE56 (50, 75, 100, 200, 250 mab). Mab = meters above bottom.

The instrument has the following dimensions (they are all roughly equal to cylinders)

a) What is the weight of all the instruments in air? In water?

The mooring also needs floating elements to stand up in the water.

b) How much can one glass sphere lift? Their diameter is 43 cm and the weigh 22 kg in air.

c) How many spheres do we need to keep the mooring up right?

Exercise 3

When the current is strong it will tend to pull the mooring down towards the bottom – that is not good. Firstly, you don’t get measurements from the depth you wanted and secondly, many of the instrument cannot measure when they tilt too much, An ADCP, for example, cannot measure correctly if the tilt is above 15 \(^\circ\). So we need to add extra floating elements to make sure that the mooring is not pulled down if the current is strong. The force from the water pulling the mooring down is proportional to the area that the water hits (i.e. the cross sectional area of the mooring).

a) What percentage of the mooring cross sectional area is made up by the rope?

b) By how much is the area reduced if we change for a line that is 6 mm in diameter?

c) An instrument was pulled down to 170 mab and 218 m downstream, another instrument was pulled down to 65 mab and 105 m downstream. The shape of the line can be decribed by (half) a parable. Find the expression for the parable!

d) The pressure sensor on the ADCP shows that it now is 40 mab. How much is it tilting? Can we use the measurements?

e) How high up must it be (at least) for the measurements to be good?

f) Why do you think we prefer to have the ADCP high up looking down, rather than deep down looking up?

mooring2
One of my moorings during an event with strong current. we use a special program to calculate how the moorings will perform in a current. The program will also tell us how heavy the anchor needs to be!

Exercise 4

When we retrieve the mooring and download the data from the instruments we get time series of current, temperature and salinity. We will now do some calciulations based on data from a mooring that was deployed in the Amundsen Sea in 2012.

a) Import and plot the current measurements from mooring S4, 17-24 June 2012 (ENG_Riggdata_S4_1). Describe what you see!

b) What is the mean current? In what direction was the water flowing? (\(u\) is the current in the \(x\)-direction (towards the east) and \(v\) is the current in the \(y\)-direction (towards the north))

c) If you were to describe the observations with a mathematical function, which one would you chose?

d) Determine the coefficient of your function!

e) An iceberg is floating with the current in the vicinity of S4. Set up an expression for it movement (using vectors) and plot its trajectory. How would you describe its movement?

f) Plot the current a week forward in time using your function from (d).

g) Import the data from S4 24/6-1/7 and plot it in the same figure. Is your model doing a good job predicting the currents? Why? Why not? (The file is named ENG_Riggdata_S4_2)


Exercise 5

Import and plot the measurements of pressure from mooring C2. The file is named ENG_Riggdata_C2. In this location the currents were much stronger than we expected and we had put on too little flotation 🙁

a) How would you interpret the record? (hint – look at exercise 2 above)

b) At what depth is the instrument located when the current is weak? (1 m \(\approx\) 1 dbar)

c) How deep is it pulled down?

d) What percentage of time is it pulled down more than 40 m? 80 m?

e) \(u\) gives the current in the \(x\)-direction (towards the east) and \(v\) gives the current in the \(y\)-direction (towards the north). Set up an expression for the current strength the calculate and plot it! How strong is the strongest current? The mean current? How many km/h is that?

f) Is there a relation between current strength and pressure (that is, the instrument pull- down?) Describe the relation mathematically and with words.

Exercise 6

The instruments are powered by batteries, and every time we make measurements we use a small amount – or a lot if it is an ADCP – energy. We want the instruments to keep measuring until we get back to pick them up – so we have to calculate beforehand how often we can make measurements without emptying the battery. But we also have to think about e.g. tides when determining how often to sample.

a) One of the components of the daily tides has a period of 25.8 h. The tidal current can be described by a sinus curve. The amplitude (and the phase) depends on where we are, but let’s assume the amplitude is 10 cm/s and the phase is 0. Set up an expression for the tidal current and plot it for 30 days.

b) If we made measurements only once a day, what would or time series look like?

c) What is the period of the “oscillation” that we would then observe?

d) The tidal current tha we observe is the sum of many components with different periods, amplitudes and phases. Another component has a period of 23.93h. Set up an expression for that tidal component if the amplitude is 9 cm/s. (You can set the phase to 0) and plot the sum of the two components. What do you see? How is the amplitude changing? How far is it between to “amplitude maximum”? Can you explain what you see? (hint: plot the components as well as the sum of them). Compare the results with the results from exercise 3!

ENG_mooring3

Eksperiment: Arkimedes prinsipp

Alle vet at Arkimedes satt i badekaret sitt og ropte «Aureka!» – men vet du hvorfor?

Til dette eksperimentet trenger du:

  • Et stort glass eller for eksempel en høy (og ikke altfor brei) skål eller karaffel (gjennomsiktig)
  • En liten plastkopp (som får plass i glasset/skålen/karaffelen)
  • Et par mynter eller steiner (eller noe annet «tungt»)
  • Et eple (eller noe annet som flyter)

Fyll glasset med vann og sett nedi plastkoppen. Fyll den deretter med så mange mynter som mulig uten at den synker. Marker (med en penn som det går an å fjerne, eller med å holde fingen) hvor høyt vannet går.

Om vi nå legger myntene i glasset, hva skjer da? Tror du at vannivået endres? Opp eller ned?

Gjett før du prøver!

Gjør forsøket på ny, denne gangen med eplet. Hva skjer da?

Experiment: Arkimedes princip

Alla vet att Arkimedes satt i sitt badkar och ropade “Heureka” – men vet du varför?

För det här experimenten behöver du

  • Ett stort glas eller t.ex. en hög (och inte alltför vid) skål eller karaff (genomsiktlig)
  • En lien plastkopp (som får plast i glaset/skålen/karaffen)
  • ett par mynt eller stenar (eller något annat “tungt”)
  • ett äpple (eller något annat som flyter)

Fyll glaset med vatten och sätt i plastkoppen. Fyll den sedan med så många mynter som det går utan att den sjunker. Markera (med en penna som går att torka bort, eller genom att hålla fingret) hur högt vattnet går.

Om vi nu i stället lägger mynten i vattnet, vad sker då? Tror du  vattennivån ändras? åt vilket håll? upp eller ner?

Gissa innan du försöker!

Gör om försöket med äpplet. Vad händer då?


Experiment: Archimedes’ principle

Everybody knows that once upon a time, Archimedes sat in his bath tub and all of a sudden shouted “Eureka!”. But do you know why he did that?

For this experiment you’ll need:

  • A large glass / jar / jug (which has to be see-through)
  • A small plastic mug (which fits inside your glass / jar / jug)
  • A couple of coins, small pebbles or something else “heavy”
  • An apple (or something else that floats)
  • A non-permanent pen

Fill the large glass with water and mark the water level on the outside of the glass. Then put the little plastic mug inside. Fill as many coins (or other “heavy” things) into the small plastic mug until it sinks. As you are filling coins into the small plastic mug, the water lever rises. Mark  how high the water level is right when there are so many coins inside the plastic mug that it sinks!

Now take all the stuff out of the large glass again. The water level goes back to where it was before.

What do you think would happen if we added all the coins to the large glass directly, without putting them inside the floating plastic cup? Do you think the water level would change? And if it changed, where would it end up relative to the two marks you already made on the glass?

Now try and check whether you guessed correctly!

Then do the experiment again, this time with the apple. What happens?

Eksperiment: Hva flyter i Dødehavet?

Du har sikkert sett bilder av folk som ligger og flyter i Dødehavet mens de leser avisen eller en bok… Men hva mer er det som flyter der?

Du trenger:

  • 2 store skåler eller plastbokser
  • Vann og (mye) salt
  • Diverse grønsaker (eller andre gjenstander som du vil teste)

Bland veldig salt vann i den ene skålen og fyll den andre med vanlig springvann. Saltholdigheten i Dødehavet er 33,7 %, men det holder med ca. 1 kg salt til 4 liter vann. Saltet løser seg lettere opp om vannet er varmt. Sett opp en hypotese (gjett) før du tester om hvilke grønsaker som flyter i ferskvann og hvilke som flyter i «Dødehavet». Er det noe som flyter i det ene men ikke i det andre? Er det noe som synker i Dødehavet?

Flyter kokosnøtten? Fra Forskningsdagene i Bergen. Foto: UNI research

Experiment: Vad flyter i Döda havet?

Du har säkert sett bilder på folk som ligger och flyter i Döda havet med en tidning eller en bok… men vad är det mer som flyter där?

Du behöver:

  • 2 stora skålar eller plastburkar
  • vatten och (mycket) salt
  • diverse grönsaker (eller andra saker som du vill testa)

Blanda väldigt salt vatten i den ena skålen (Salthalten i Döda havet är 33.7%, men ta ca 1 kg salt till 4 liter vatten, det räcker fint! Saltet löser sig lättare om vattnet är varmt.) och fyll den andra med vanligt kranvatten. Sätt upp en hypotes (gissa) vilka grönsaker som flyter i färskvatten och vilka som flyter i “Döda havet” innan du testar!. Är det någon som flyter i det ena men inte i det andra? är det något som sjunker i Döda havet?

Flyter kokosnöten? Från Forskningdagarna i Bergen. Foto: UNI research


Experiment: What floats in the Dead Sea?

You have probably seen the picture of people floating on their backs in the Dead Sea, reading a newspaper or a book. But do you know why they are floating?

You need:

  • 2 large plastic containers
  • Water and a lot of salt
  • Different kinds of vegetables and fruits (or other things you might want to experiment with)

Mix a lot of salt with the water (salt dissolves more easily if the water is warm!) in one of the plastic containers to represent the Dead Sea, and fill the second container with tub water at the same temperature as your “Dead Sea”. In the Dead Sea, the salinity is 33,7%, that means to reproduce that you need ca 1 kg salt for 4 liters of water!

Now look at all your fruits and vegetables. Which, do you think, will float in the “Dead Sea”? Which will sink? Does your answer change if you look at your second container with tub water?

Flyter kokosnøtten? Fra Forskningsdagene i Bergen. Foto: UNI research

Does the coconut float? Fra Forskningsdagene i Bergen. Foto: UNI research

Bredvid iskanten

När jag tittade ut genom fönstret tidigare idag när jag var på väg ned till matsalen var allt jag såg en vit vägg. En vit vägg av is som sträckte sig både åt höger och vänster så långt ögat kunde nå (vilket inte var så väldigt långt efter som det snöade lätt och dimman, precis som så många andra dagar i det sista, envisades med att förfölja oss). Det var Dotson shelfisen, en av de mindre shelfiserna i Amundsenhavet, som majestätiskt tornade upp sig framför oss. Biologerna hade en station precis framför iskanten och ett av planktonnäten var precis på väg ner i djupet. Runt middagsbordet gick diskussionen het – hur hög är egentligen den där väggen vi ser? Tio meter? Tjugo? Trettio? Gissningarna haglade – men ingen hade svaret. Så när middagen (bläckfisk, friterad sötpotatis och ris) var avklarad gick vi upp på bron och bad kaptenen om att få låna sextanten (google eller wikipedpia kan nog förklara vad det är bättre än jag) . Medan en av matroserna letade i skåpen efter den så tog vi en titt på radarskärmen och noterade att avståndet till väggen var en halv sjömil (1 sjömil= 1852m). Innan matrosen hade hittat vad han letade efter (och innan vi lärt oss hur sextanten fungerar) var planktonnätet uppe på däck och vi var på väg till nästa station. När vi äntligen mätte vinkeln (0.77 grader) var avståndet till väggen 1.5 sjömil. Hur hög var väggen? Den som vill vara riktigt noggrann behöver också veta att bron är 16.7 meter över havet och att sextanten var 1.5 m över golvet när vi mätte vinkeln. Men skillnaden mellan att vara “noggrann” och att förenkla (det finns många sätt att göra det på) problemet är förvånadsvärt liten!

DSC_0022
Ett, två, tre hopp! (Foto: Elin Darelius Chiche)

När båten stannar igen är “väggen” fortfarande där. CTD:n ska i vattnet. De koreanska oceanograferna jobbar i skift och det är alltid någon på vakt i CTD-rummet. Just nu är det Ta-wan som sitter framför den stora skärmen och knappar på datorn medan matroserna gör klar vinschen och själva CTD:n ute på däck. Det har börjat snöa igen och det blåser kallt, så jag stannar kvar i värmen inne hos Ta-wan. Radion sprakar till och jag hör några korta meningar på koreanska – samtidigt dyker det upp röda, gröna och vita linjer på skärmen framför oss, så meddelandet förkunnade tydligen att CTD:n nu är i vattnet. CTD:n får stå kvar i ytan en stund, tills pumpen (som ser till att samma vatten kommer till de olika sensorerna) har startat och allt fungerar som det ska. Sen bär det iväg ner i djupet! Graferna ritas upp “live” och linjerna på skärmen blir längre allt eftersom kabeln rullas ut och CTD:n sjunker ner. De första 30-40 metrarna är vattnet är vattnet relativt färskt (33.9) och mellan 0-0.5C; det här är ytlagret, det har blandats av vinden, värmts av solen och blivit färskt därför att det spätts ut med smältvatten från smältande havsis, snö och isberg. När vi lämnar ytlagret stiger salthalthalten till 34.2 och temperaturen sjunker till -1.5C och sen förblir både salthalt och temperatur ganska konstant i flera hundra meter. Det är “vinter vatten”, vatten som kylts av under vintern.

CTD
CTD:n är på väg ner i djupet framför Dotson shelf-isen. (Foto: Elin Darelius Chiche)

Tillbaka till skärmen där trycksensorn visar att vi nu nått ner till 400 m och där både temperaturen och salthalten plöstligt börjat stiga. Den blåa linjen, den som visar temperatur, försvinner till slut ut från figuren. Medan Ta-wan knappar på tangentbordet för att ändra skalan på grafen så tippar vi andra hur högt den kommer gå. När Ta-wan fått ordning på figuren kan vi konstatera att Karen och Göteborgs Universitet gått av med segern, och att det varmaste vattnet här inne vid shelfisen är 0.64 C. Det här är det varma vatten vi är här för att studera, “Circumpolar Deep Water”,som funnit vägen upp på kontinentalsockeln och strömmar söderut mot shelfisen längst botten av Dotson Trough (kanske den kan kallas Dotson Rännan på svenska/norska?), en djup ränna som isen själv grävt ut en gång för länge sen när klimatet var kallare och istäcket över Antarktis var mycket större och tjockare än vad det är i dag.

CTD:n har nått botten och framför oss på skärmen ser vi tre lager med vatten, eller tre vattenmassor, som vi oceanografer skulle kalla dem. Vattnet med lägst densitet, det lättaste vattnet, flyter överst (precis som när lätt olja flyter på tungt vattnet) och vattnet med högst densitet ligger underst. Men nu räcker det med oceanografi för i dag. Klockan blivit åtta och jag lämnar Ta-wan och de andra i CTD-rummet och beger mig upp till träningsrummet och pingisbordet. Povl (en dansk oceanograf som sedan många år jobbar på British Antarctic Survey i Cambridge, UK) och jag har blivit utmanade av Monsieur Park och Isabelle från L’Ocean i Paris, så här gäller det att kavla upp ärmarna och försvara de skandinaviska färgerna!

DSC_0430_LR
Ett av de vackrare isbergen vi seglat förbi! (Foto: Elin Darelius Chiche)


Ps – medan vi var uppe och spelade pingis så satte Nicole (från Rutgers University, USA) en “glider” i vattnet. Glidern kan ändra sin volym (och därmed sin densitet, eftersom massan inte ändras) och med hjälp av sina vingar kan den, fullastad med sensorer, därmed flyga upp och ned i vattnet. En självgående CTD, helt enkelt! När den är uppe i ytan skickar den hem data och position via sateliter, och den kan också ta emot nya order om vart den ska simma, hur djupt den ska dyka, och vilka sensorer som ska vara på. Om ni går in på www.marine.rutgers.edu/cool/auvs och letar efter glider RU25 så kan ni se vad glidern har gjort och vad den samlat in för data!

glider
Nicoles glider på väg ner i vattnet (vingarna är inte monterade ännu) (Foto: Elin Darelius Chiche)


Ps 2 – Skandinavien vann!

Oppgaver og øvelser

Norsk

Svenska

Alongside the ice shelf

When heading down for dinner earlier today I glanced out through my window and all I saw was a white “wall”. A white wall of ice extending to the right and the left for as far as I could see (which admittedly wasn’t very far, since it was snowing and a light mist caused the horizon to disappear). We are in front of the Dotson ice shelf, one of the smaller ice shelves in the Amundsen Sea. The biologists had a station right at the ice shelf front, and one of the plankton nets just went down into the water. How high is the wall? Ten meters? Twenty? Thirty? There was a lively discussion around the dinner table and there were plenty of guesses – but no answer, so when the dinner (squid, sweet potatoes and rice) was finished we all headed up to the bridge and asked the captain if we could borrow the sextant (Google or Wikipedia will do a better job explaining what it is than I’d do). We had a look at the radar screen while one of the deck hands searched in the cupboard for the sextant. The wall was half a nautical mile (1 nm=1852 m) away. Before we the sextant was located (and before we’d learnt how to use it) the plankton net was back on deck and we were heading to the next station. When we finally managed to measure the angle (0.77 degrees) the wall was 1.5 nm away. Now, how high was the wall? If you want to do it correctly, you also need to know that the bridge is 16.7m above sea level and the sextant was 1.5m above the floor. But does it matter if you do it “correctly”? The difference between the “correct” solution and the simplified solution is surprisingly small!

DSC_0022
One, two, three, jump! (Photo: Elin Darelius Chiche)

When Araon stops again the “wall” is still there, we are still along the front of the Dotson ice shelf. The CTD is going into the water. The
Korean oceanographers are working in shifts and there is always someone on guard in the CTD-room. This time it is Ta-wan who is placed in front of the big CTD-screen while the deck hands are preparing the winch and the CTD outside. It is snowing and the wind is rather chilly, so I decide to stay inside with Ta-wan. The radio calls for attention and I hear a few short sentences in Korean – at the same time, the screen comes to live in front of Ta-wan. The CTD has gone into the water. We wait with the CTD just below the surface until the pump has started and everything is working as it should. Then, down she goes! The data collected by the CTD is displayed “live” on the screen in front of us, and the lines grows longer as the CTD sinks down. During the first 30-40 meters the water is relatively fresh (33.9) and the temperature between 0C and 0.5C; this is the surface layer – mixed by the wind, warmed by the sun and freshened because it’s been diluted by meltwater from melting sea ice and ice bergs. When we go deeper, the salinity increases to 34.2 and the temperature sinks to -1.5C, and it then remains roughly constant for several hundreds of meters. This is “winter water”, water that has been cooled down during winter.

CTD
CTD measurements alongside the Dotson ice shelf. (Photo: Elin Darelius Chiche)

Back to the screen; the pressure sensor shows us that we’ve reached down to 400 m depth and the temperature and the salinity has started to increase. The blue line that shows the temperature is heading out of the figure, off the scale. While Ta-wan searches through the menus on the side to change the scale, the rest of us places bets on the maximum temperature. When the scale is changed and the blue line is back on the screen we learn that the winner isŠ Karen and the University of Gothenburg! The warmest water reaching the front of the ice shelf was 0.64C – this is the water we are here to study, the “circumpolar deep water” that has found its way onto the continental shelf and southward towards the ice shelf through the Dotson trough, a deep trough that the ice has carved a long time ago when the climate was colder and the Antarctic ice sheet was bigger and thicker than it is today.

The CTD has reached the bottom and we see three layers of water on the screen. Three layers, or water masses, as we oceanographer would call them. The water with the lowest density is floating on top – just like the light oil floats on top of the heavier water – and the water with the highest density at the bottom.

But enough oceanography for today – the clock has just struck eight and I leave Ta-wan and the others in the CTD-room to head to the training room and the ping-pong table. Povl ( a Danish oceanographer working at British Antarctic Survey in Cambridge, UK) and I have been challenged by Monsieur Park and Isabelle from L’Ocean in Paris, so we’ll have to stand up to defend the Scandinavian colors.

DSC_0430_LR
One of the most beautiful ice shelfs. (Photo: Elin Darelius Chiche)

Ps – while we were up playing tabletennis Nicole (from Rutgers University,US) deployed her glider. The glider can change its volume (and hence its density) and using it swings it can fly up and down through the water carrying with it a bunch of sensors – an autonomous CTD! While at the surface, it sends home data, position via satellites, and at the same time it receives new orders about where to swim, how deep to dive, what sensors to turn on etc. If you visit www.marine.rutgers.edu/cool/auvs and look for glider RU25 you can see what her glider is up to!

glider
Nicole’s glider dives into the water (the wings are not mounted yet)(Photo: Elin Darelius Chiche)

Ps 2 – Scandinavia won!


Do the Math! Salinity, temperature and density


Experiments:

Preparing a layered drink

Build your own thermometer!

How much salt is there in the ocean?