
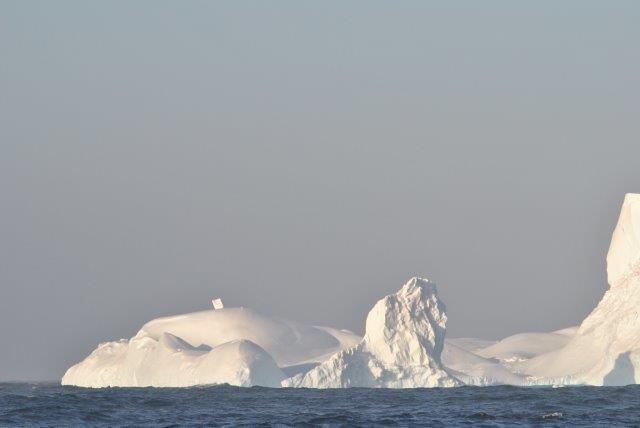
When heading down for dinner earlier today I glanced out through my window and all I saw was a white “wall”. A white wall of ice extending to the right and the left for as far as I could see (which admittedly wasn’t very far, since it was snowing and a light mist caused the horizon to disappear). We are in front of the Dotson ice shelf, one of the smaller ice shelves in the Amundsen Sea. The biologists had a station right at the ice shelf front, and one of the plankton nets just went down into the water. How high is the wall? Ten meters? Twenty? Thirty? There was a lively discussion around the dinner table and there were plenty of guesses – but no answer, so when the dinner (squid, sweet potatoes and rice) was finished we all headed up to the bridge and asked the captain if we could borrow the sextant (Google or Wikipedia will do a better job explaining what it is than I’d do). We had a look at the radar screen while one of the deck hands searched in the cupboard for the sextant. The wall was half a nautical mile (1 nm=1852 m) away. Before we the sextant was located (and before we’d learnt how to use it) the plankton net was back on deck and we were heading to the next station. When we finally managed to measure the angle (0.77 degrees) the wall was 1.5 nm away. Now, how high was the wall? If you want to do it correctly, you also need to know that the bridge is 16.7m above sea level and the sextant was 1.5m above the floor. But does it matter if you do it “correctly”? The difference between the “correct” solution and the simplified solution is surprisingly small!
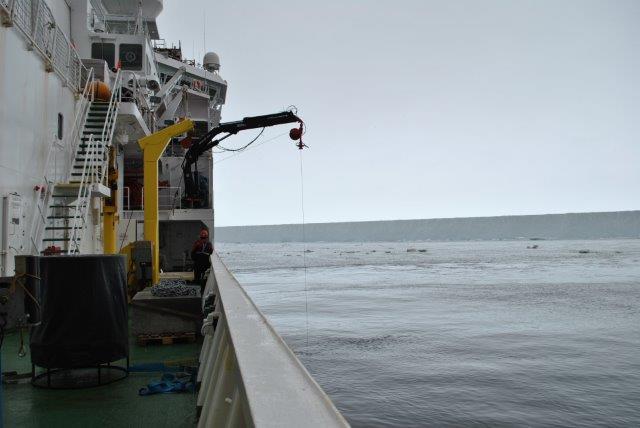
When Araon stops again the “wall” is still there, we are still along the front of the Dotson ice shelf. The CTD is going into the water. The
Korean oceanographers are working in shifts and there is always someone on guard in the CTD-room. This time it is Ta-wan who is placed in front of the big CTD-screen while the deck hands are preparing the winch and the CTD outside. It is snowing and the wind is rather chilly, so I decide to stay inside with Ta-wan. The radio calls for attention and I hear a few short sentences in Korean – at the same time, the screen comes to live in front of Ta-wan. The CTD has gone into the water. We wait with the CTD just below the surface until the pump has started and everything is working as it should. Then, down she goes! The data collected by the CTD is displayed “live” on the screen in front of us, and the lines grows longer as the CTD sinks down. During the first 30-40 meters the water is relatively fresh (33.9) and the temperature between 0C and 0.5C; this is the surface layer – mixed by the wind, warmed by the sun and freshened because it’s been diluted by meltwater from melting sea ice and ice bergs. When we go deeper, the salinity increases to 34.2 and the temperature sinks to -1.5C, and it then remains roughly constant for several hundreds of meters. This is “winter water”, water that has been cooled down during winter.
Back to the screen; the pressure sensor shows us that we’ve reached down to 400 m depth and the temperature and the salinity has started to increase. The blue line that shows the temperature is heading out of the figure, off the scale. While Ta-wan searches through the menus on the side to change the scale, the rest of us places bets on the maximum temperature. When the scale is changed and the blue line is back on the screen we learn that the winner isŠ Karen and the University of Gothenburg! The warmest water reaching the front of the ice shelf was 0.64C – this is the water we are here to study, the “circumpolar deep water” that has found its way onto the continental shelf and southward towards the ice shelf through the Dotson trough, a deep trough that the ice has carved a long time ago when the climate was colder and the Antarctic ice sheet was bigger and thicker than it is today.
The CTD has reached the bottom and we see three layers of water on the screen. Three layers, or water masses, as we oceanographer would call them. The water with the lowest density is floating on top – just like the light oil floats on top of the heavier water – and the water with the highest density at the bottom.
But enough oceanography for today – the clock has just struck eight and I leave Ta-wan and the others in the CTD-room to head to the training room and the ping-pong table. Povl ( a Danish oceanographer working at British Antarctic Survey in Cambridge, UK) and I have been challenged by Monsieur Park and Isabelle from L’Ocean in Paris, so we’ll have to stand up to defend the Scandinavian colors.
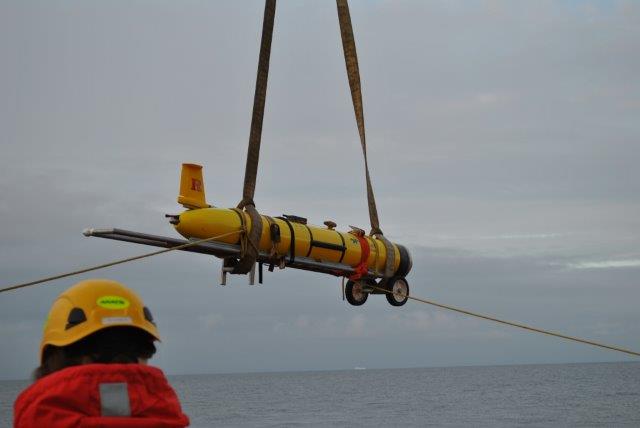
Ps – while we were up playing tabletennis Nicole (from Rutgers University,US) deployed her glider. The glider can change its volume (and hence its density) and using it swings it can fly up and down through the water carrying with it a bunch of sensors – an autonomous CTD! While at the surface, it sends home data, position via satellites, and at the same time it receives new orders about where to swim, how deep to dive, what sensors to turn on etc. If you visit www.marine.rutgers.edu/cool/auvs and look for glider RU25 you can see what her glider is up to!
Ps 2 – Scandinavia won!
Do the Math! Salinity, temperature and density
Experiments: