(by: Jori Neteland-Kyte, Sara Elisabeth Holen Sælen , Susanne Moen Olsen)
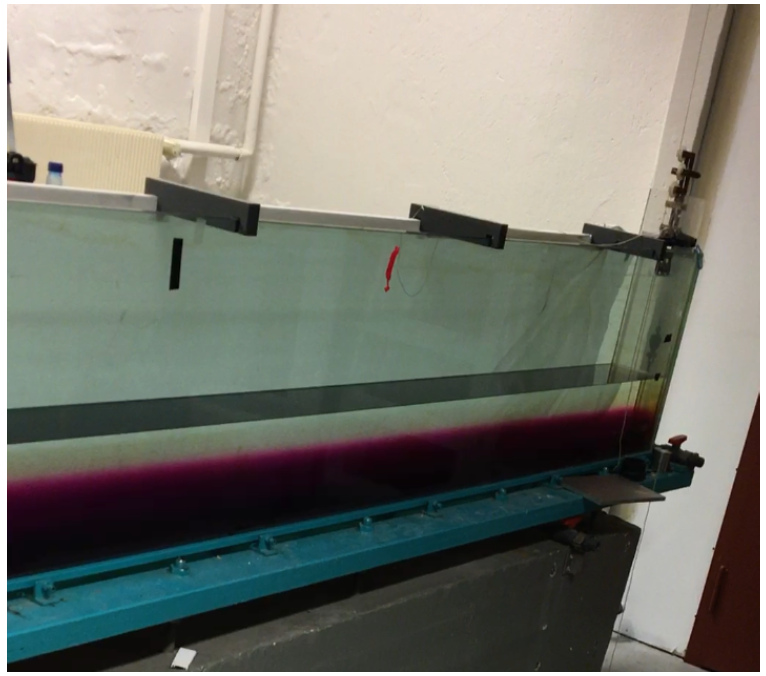
Lee waves are a type of internal gravity waves, which is generated as fluid moves over an obstacle. The fluid needs to be stably stratified for this to occur. These waves can occur in both the atmosphere and in the ocean. (Cushman-Roisin and Beckers, 2011, page 412) To show this phenomenon it is convenient to perform a simple experiment, where a long tank is used. The tank is filled with stratified water, the bottom layer is denser than the layer above. A purple color is added to the denser water at the bottom layer, as seen in Figure 1. This is done to distinguish between the two layers. The tank is also equipped with a moving obstacle which is possible to move at different constant velocities across the bottom of the tank.
Figure 1:The initial state of the two-layered stratified fluid.
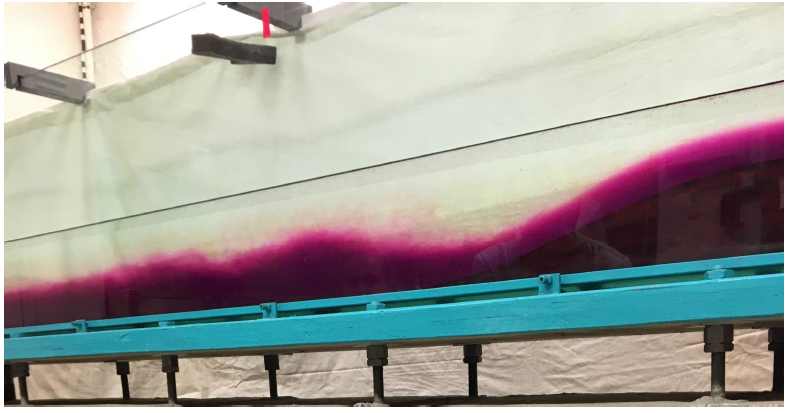
When the obstacle is moved across the tank, waves are generated in the interface between the layers as seen in the figure 2.
Figure 2:Wave are generated when the obstacle is moved with the lowest speed.
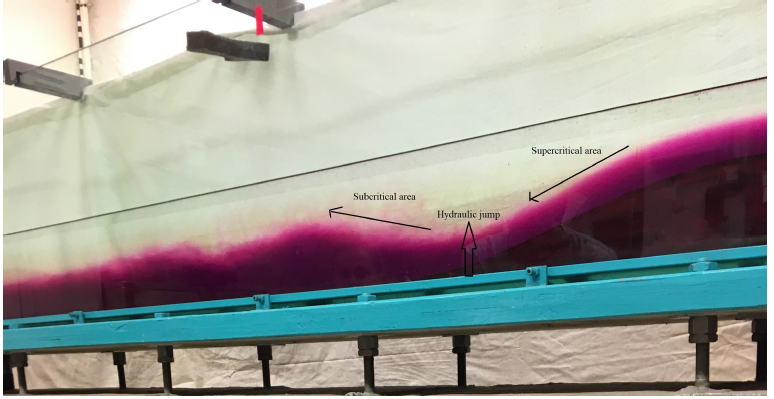
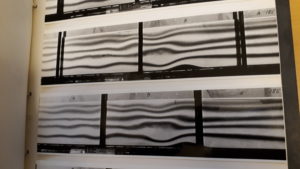
Figure 3. displays how the Lee waves propagates, with the positions for the supercritical area, the hydraulic jump and subcritical area marked by the arrows. The supercritical area is positioned directly above the moving obstacle, which appears as one smooth wave. In the transition between the supercritical and the subcritical area, the hydraulic jump is found. This occurs at the end of the descending side of the moving obstacle. Following behind the
hydraulic jump is the subcritical area, this is where a train of waves are generated. These waves decays with time.
Figure 3: Position of sub- and super critical flow and the hydrualic jump.
There hasn’t been much happening on this blog lately, since I’ve been busy, busy, busy teaching geophysical fluid dynamics to the third year bachelor students here at GFI. My job description as an associate professor at UiB includes 50% teaching – however giving the (somewhat equation heavy) course for the first time it felt more like 150%… but now the last lecture is given, the students are happily (?) preparing for the exam, and I finally have time to do some science… and to update the blog!
First I’ll have the students tell and show you what they did with Mirjam when she was visiting the Bjerknes centre and Bergen in October. One flight of stairs down from my office, in the basement of GFI, there is a 6 m long tank. It is not round and it is not rotating (like the tank in Grenoble), but it can move mountains! Or rather, it holds a mountain that can be moved. Why would one want to move a mountain in a tank? Well, as Arne Foldvik, the professor emiritus who built the tank a few decades ago realized, if you want to study flow over topography in the lab, then it is easier to have the fluid move beneath the fluid than to make the fluid move over the mountain… and the physics are the same.
Arne (who later left the lab and became on of the Norwegian pioneers in Antarctic oceanography) spent years with the tank – my student only spent an hour but they did some really nice stuff! Thank you again Mirjam for setting it all up – and thanks to the students for handing in the (non-compluslory) assignments that you’ll be able to read (and watch) in the days to come!
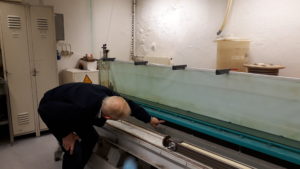
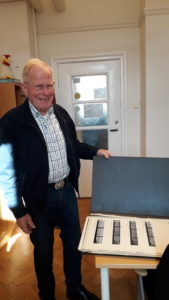
Below you see Arne Foldvik showing off his results – and inspecting his old tank.
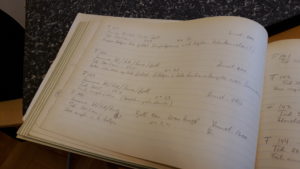
Arne Foldvik inspecting his tankAll Arne’s experiments were documented by GFI’s in house (!) photographer!Detailed logbooks…
This week in Davos (Switzerland) about 2000 people are gathering to talk about Polar Sciences!
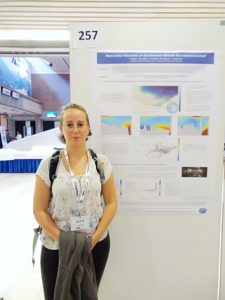
I (Lucie Vignes) am here to listen to a lot of talk about ocean dynamics, ocean-ice interactions but also talks about sciences-policy issues and women’s perspectives on Polar research! I came with a poster a well, speaking about both data from the Weddell Sea and our experiments in Grenoble. It was a good occasion to meet very interesting people and to share my research. This is my first big conference!
In front of my poster at Polar 2018. Photo: Lucie Vignes
Antarctica has been in the headlines the last week – see e.g. the Guardian or Bergens Tidene – as a large group of scientists concluded in Nature that the Antarctic ice sheet has lost 2720 billion of tons of ice since 1992. 2720 billion tons… that’s enough ice to cover all of Norway with almost 8 m of ice… or to rise the mean sea level with 8 mm.
The uncertainty is large, especially for East Antarctica, because it is not easy an easy task to quantify the mass change of Antarctica. Over the years three main techniques have been developed, either building on satellite altimetry (measurements of the height of the ice sheet), gravimetry (measurements of the gravitational pull on satellites) or budget calculations (combining estimates of snowfall with estimates of ice loss at the boundary of the continent) – each with it’s own set of challenges and uncertainties. The author’s have combined results from 24 independent studies, using different methods and models, and the results are unambiguous: Antarctica has been losing mass and the rate of ice loss is accelerating.
Climate is changing; the ice loss is likely to continue and the sea level will continue to rise. It’s scary. I can go back into my office and try to understand more about what role the ocean is playing and about what is happening down south – but I cannot stop it. Not on my own. But maybe, hopefully, we can still do it together, all of us.
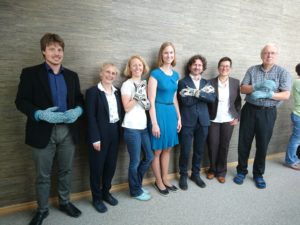
Yesterday Kjersti successfully defended her thesis “Exchange of water masses between the Southern Weddell Sea continental shelf and the deep ocean”!! Hipp hurray for Kjersti! Kjersti is my first PhD-student who finishes – so I admittedly was a bit nervous… but not as nervous as Kjersti… But she did (as usual!) an excellent job presenting her work to relatives and colleagues her at GFI – and she responded nicely to all the questions from the opponents: Karen Hayewood and Angelica Renner. We had the chance to have three excellent female oceanographers at the stage at GFI – that’s does not happen that often!
Supervisors, opponents and PhD. Kjersti Daae! Photo: Ellen Grong
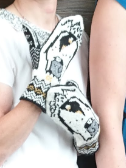
While finishing off her thesis Kjersti had found the time to knit mittens to us all (see photo and note the Penguins!) – thank you Kjersti!
Kjersti’s Penguin mittens – will definitely join me on my NeXT trip Down south!
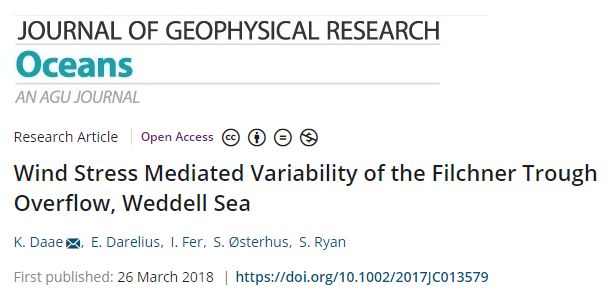
This semester has been very busy. I have been working simultaneously on two papers, as well as written and submitted my doctoral thesis. Two days before I submitted my PhD-thesis I received some very good news. My paper on the Filchner overflow was accepted! I was very pleased to include the acceptance status in my thesis.
You can read the full version of the paper if you click here … or read the summary below:
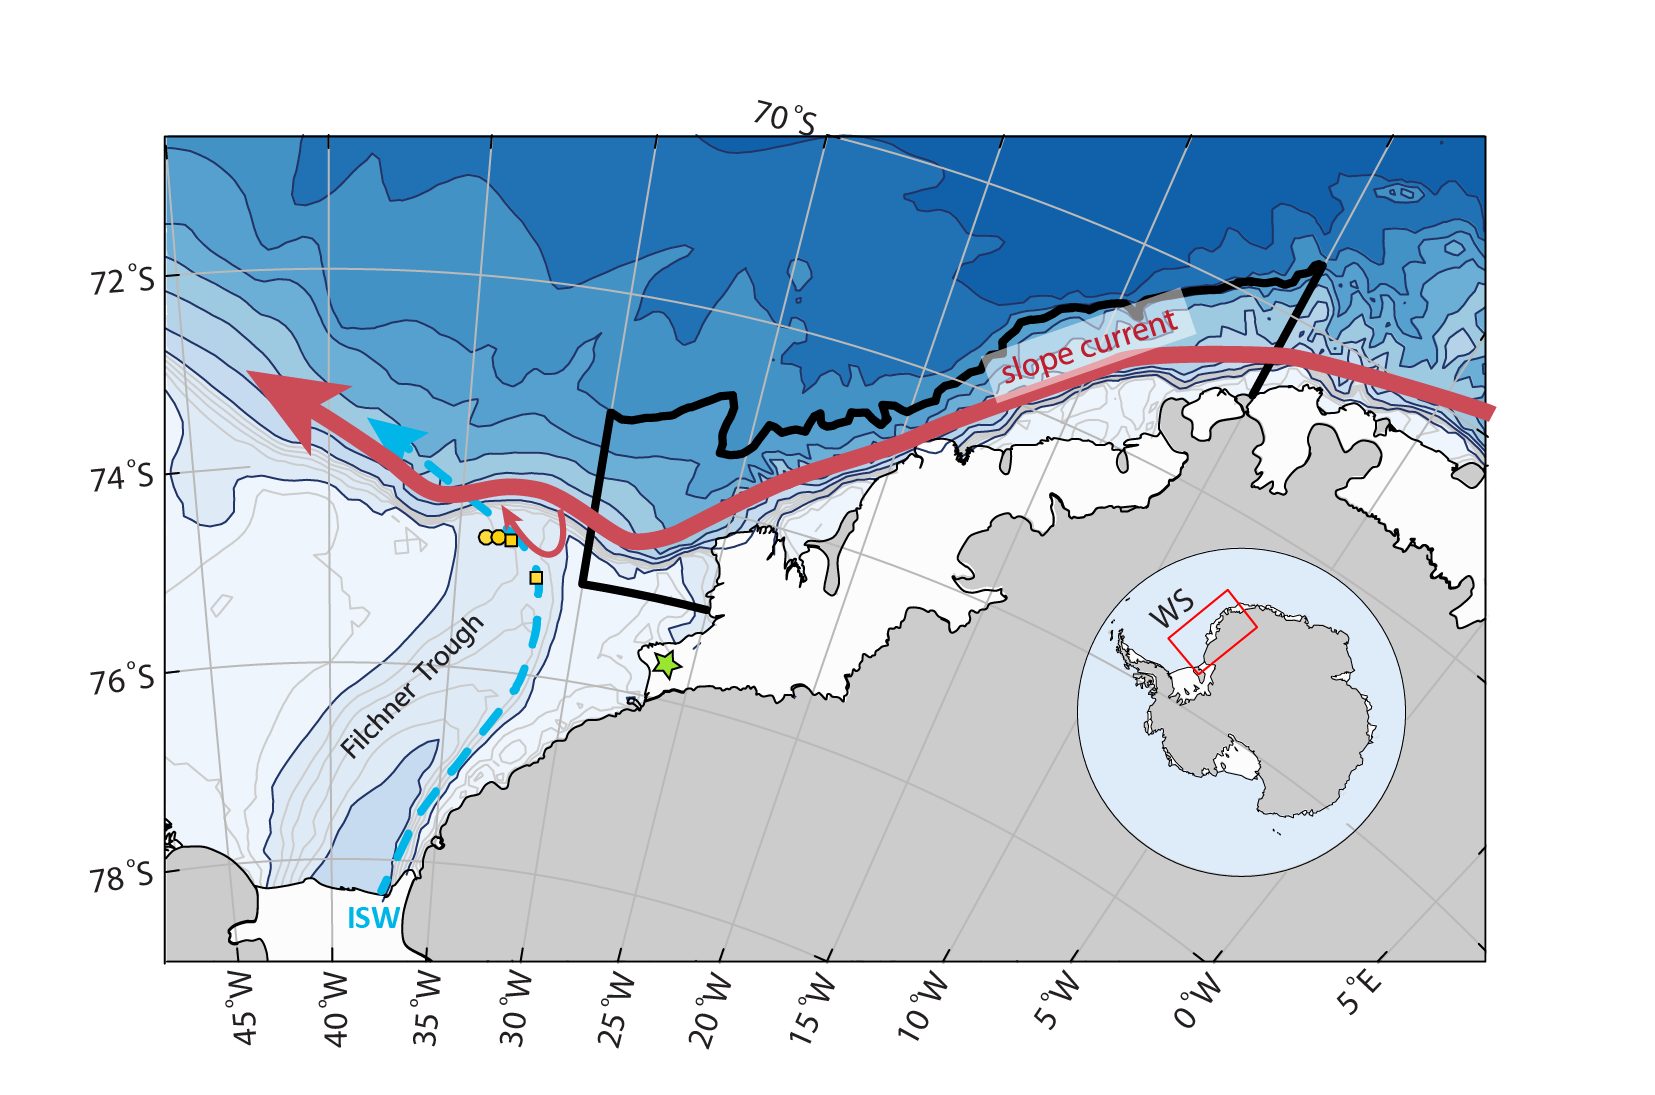
During a large part of my PhD, I have been studying processes associated with the production and pathways of cold Ice Shelf Water (ISW) in the Weddell Sea (see map in Figure 1). ISW is formed under the Filchner-Ronne ice shelf and is flowing northward along the Filchner Trough. The ISW overflows the Filchner sill, mixes with warmer water masses and form Antarctic Bottom Water.
(You can read more about ISW here )
Figure 1. Map of the southeastern Weddell Sea. Moorings on the Filchner Sill are shown with yellow markers. The red arrow indicates the slope current, with a thin recirculationg branch over the Filchner sill. The blue dashed arrow indicate the northward flow of ISW in the Filchner Trough. Upstream wind is calculated from model reanalysis products in the area inside the thick black border. The green star shows the Halley research station where also observational wind data is available.
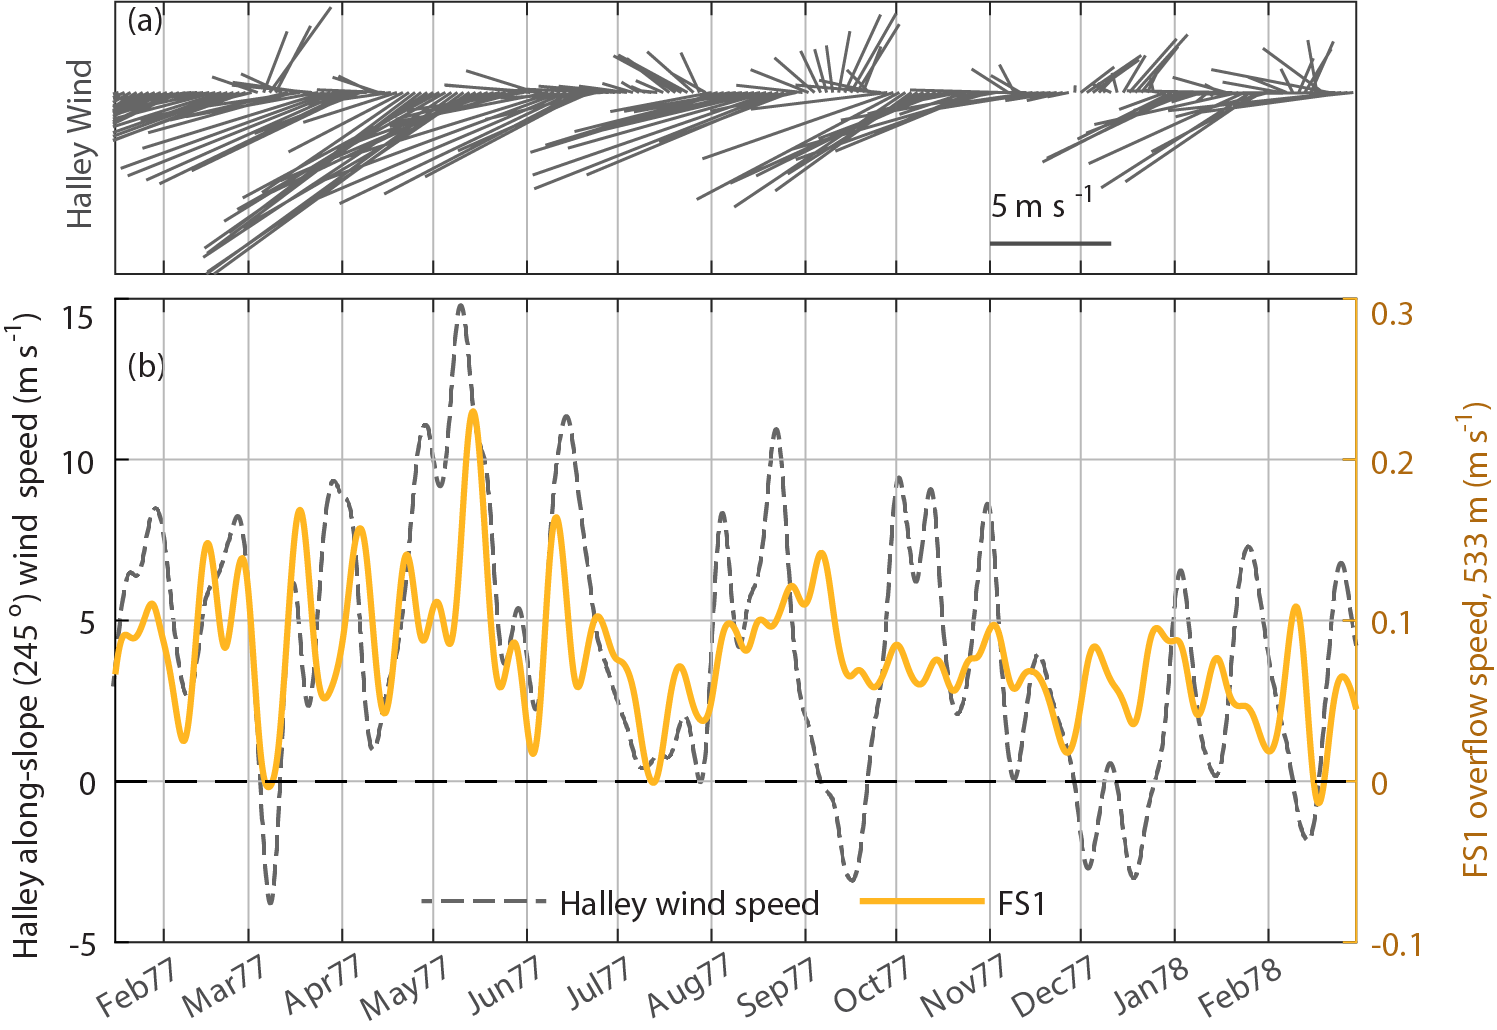
At the Filchner Sill, several year-long records of current velocity exist between 1977 and 2017. The records show large fluctuations in the Filchner overflow velocity. However, no previous studies have been able to figure out which mechanisms contribute to the strong current fluctuations. Most of the current records contain about one year of data, and are therefore too short to capture long-term variations that may be related to climate change or long-term variability. We focused instead on monthly time scales, and found a link between the variability of the Filchner overflow and the wind forcing. Strong wind along the continental slope leads to higher Filchner overflow velocity (Figure 2).
Figure 2. Along-slope wind from Halley Research station (gray) and Filchner overflow velocity from a mooring at the Sill (yellow) in 1977. High correlation is found between February and September, when the wind-forcing along the continental slope (245o) is strong.
So how can the along-slope wind upstream of the Filchner Trough influence the Filchner overflow?
We think that the slope current, which is flowing westward along the continental slope, may hold the key to answering this question. In a previous model study (Daae et.al, 2017 ), we found that parts of the slope current takes a detour, and circulates over the Filchner trough mouth region during strong wind-forcing (indicated by the thin red arrow in Figure 1). This circulation may interact with the Filchner overflow and lead to enhanced overflow. Although the existing data set is insufficient to prove that this is what happens, we present measurements at different locations which are consistent with this hypothesis.
Elin was part of a team that deployed several moorings across the Filchner sill and the continental slope in 2017. We hope that the data from these moorings, will contribute to increase our understanding of the Filchner overflow variability and out hypothesis of interaction between the slope current and the Filchner overflow.
I am a PhD-student (defending my thesis now in June – puh!) working with Elin at the Geophysical Institute, University of Bergen, working on the exchange of water masses between the continental shelf and the deep ocean in the Southern Weddell Sea, Antarctica.
Based on idealized modeling and moored observations, I study mechanisms that can bring warm water of oceanic origin onto the continental shelf and contribute to basal melting of the ice shelves. Furthermore, I study the production and export of cold and dense shelf waters, which overflows the Filchner sill, mixes with off-shore water masses and forms Antarctic bottom water. Antarctic bottom water is an important driver of the global thermohaline circulation, and is found near the bottom, in the large oceans.
Tomorrow I’ll tell you about one of the articles in my PhD-thesis that just got published!
…Hurray! We got money from the university to send Nadine (and some instrumentation) onboard “Kronprins Håkon” (KPH amongst friends) to Antarctica next season! KPH is the brand new Norwegian icebreaker and she will sail down to Dronning Maud Land and Fimbullisen in February, 2019.
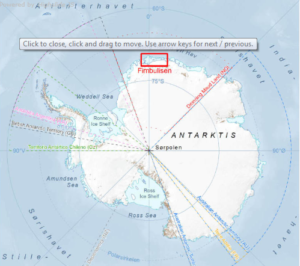
Fimbullisen is a relatively small ice shelf that overhangs the continental slope in the eastern Weddell Sea. The Norwegian Polar Institute (NPI) has three sub-ice shelf moorings installed there, and two years ago we added an APRES (a handy little thing that you place on top of the ice to measure time series of ice shelf thickness from which one can infer the basal melt rate) to one of their sites. The plan is now to – in collaboration with NPI – also measure what happens outside of the ice shelf cavity.
Map over Antarctica with the Fimbull ice shelf marked in red. From npolar.no.
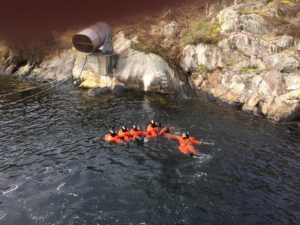
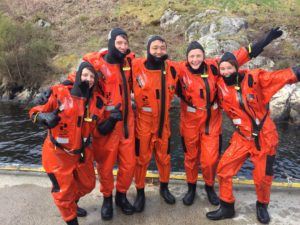
Going on a scientific cruise is mostly exciting, interesting and fun, but it is also linked to risks.
I participated in a survival suit course that prepares us for emergencies on the ship during which we have to use floating suites and life rafts to survive in cold waters far away from help. During the training we learned how to handle the suits, swim in them, build formations to stay close together and how to enter a life raft that contains all survival equipment. It was a lot of fun and we are now well prepared for our next cruise!
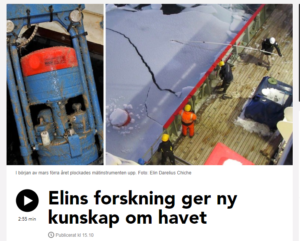
Those of you who understand Swedish (or is it “Svorsk”?) can listen to me trying to explain what we do in Antarctica to a Swedish journalist here: Radio Halland