
This semester has been very busy. I have been working simultaneously on two papers, as well as written and submitted my doctoral thesis. Two days before I submitted my PhD-thesis I received some very good news. My paper on the Filchner overflow was accepted! I was very pleased to include the acceptance status in my thesis.

You can read the full version of the paper if you click here … or read the summary below:
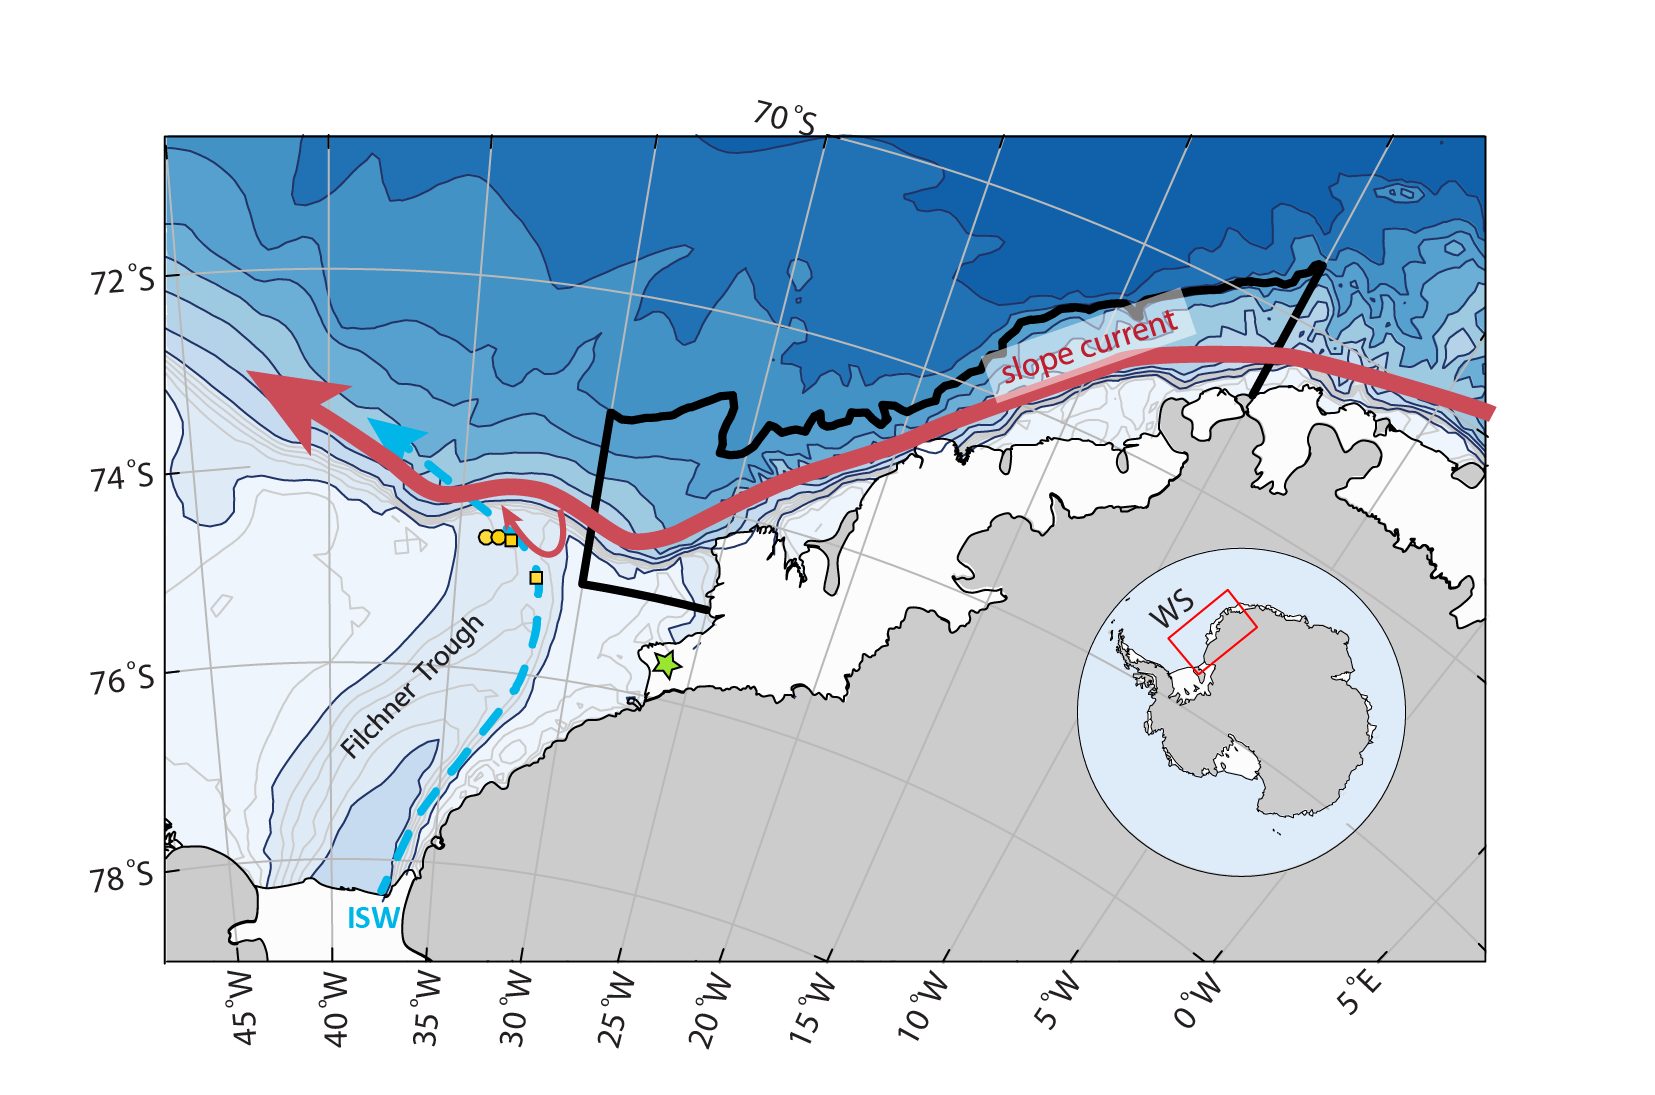
During a large part of my PhD, I have been studying processes associated with the production and pathways of cold Ice Shelf Water (ISW) in the Weddell Sea (see map in Figure 1). ISW is formed under the Filchner-Ronne ice shelf and is flowing northward along the Filchner Trough. The ISW overflows the Filchner sill, mixes with warmer water masses and form Antarctic Bottom Water.
(You can read more about ISW here )
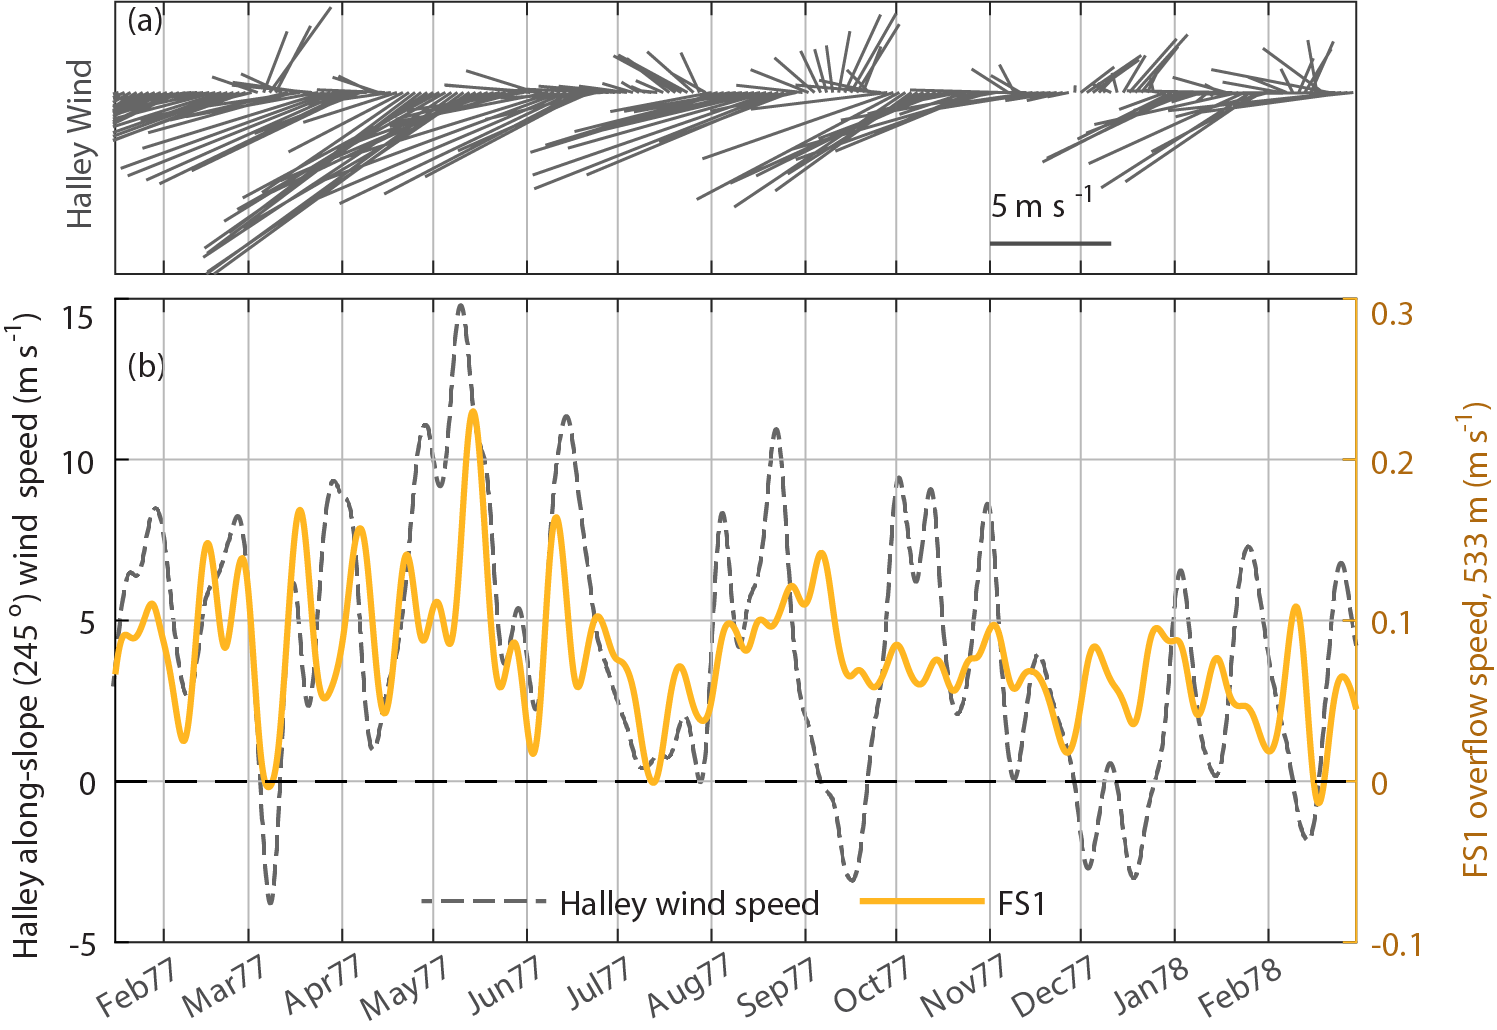
At the Filchner Sill, several year-long records of current velocity exist between 1977 and 2017. The records show large fluctuations in the Filchner overflow velocity. However, no previous studies have been able to figure out which mechanisms contribute to the strong current fluctuations. Most of the current records contain about one year of data, and are therefore too short to capture long-term variations that may be related to climate change or long-term variability. We focused instead on monthly time scales, and found a link between the variability of the Filchner overflow and the wind forcing. Strong wind along the continental slope leads to higher Filchner overflow velocity (Figure 2).
So how can the along-slope wind upstream of the Filchner Trough influence the Filchner overflow?
We think that the slope current, which is flowing westward along the continental slope, may hold the key to answering this question. In a previous model study (Daae et.al, 2017 ), we found that parts of the slope current takes a detour, and circulates over the Filchner trough mouth region during strong wind-forcing (indicated by the thin red arrow in Figure 1). This circulation may interact with the Filchner overflow and lead to enhanced overflow. Although the existing data set is insufficient to prove that this is what happens, we present measurements at different locations which are consistent with this hypothesis.
Elin was part of a team that deployed several moorings across the Filchner sill and the continental slope in 2017. We hope that the data from these moorings, will contribute to increase our understanding of the Filchner overflow variability and out hypothesis of interaction between the slope current and the Filchner overflow.