“Observed vulnerability of Filchner-Ronne Ice Shelf to wind-driven inflow of warm deep water”*
Let’s talk ab’t a favourite paper
“Observed vulnerability of Filchner-
Ronne Ice Shelf to
wind-driven inflow
of wa(-a-a-a-a)rm deep water”
An ice shelf is ice that is floating
on top of the sea as it’s flowing
down from a continent
this one is prominent
more ar’onl’ the Ross Shelf is coating.
In oc’nographers’ jargon, “deep water”
(as we learned by heart at my alma mater)
are defined by their propertie’
and live in the deep, deep sea
and currently they are getting hotter.
But “warm” is a relative measure
bathing in it would be no pleasure
it’s temperature typically
less than just one degree!
Go measure yourself at your leisure!
As winds weaken now during summer
warm water, like led by a plumber,
climbs up the continent
and can now circumvent
sills and reach ice from under.
If temperatures rise as projected
a lot of the ice will be ‘ffected.
Raising the lev’l o’ sea,
changing hydrography,
which needs to be further dissected.
Because of its climatic impact
which Elin has now shown to be fact
we need close observation
of deep water formation
so all changes can carefully be tracked.
The shelf break and the ice shelf front—Two topographic barriers
So far, we’ve explained you that outside the Antarctic continent, warm and saline water (Circumpolar Deep Water, CWD) is located beneath fresh and cold water (Surface Water). We’ve also explained you that if this warm and saline water gets onto the continental shelf and mixes with high salinity shelf water, it melts the ice shelf from below. You think that sound easy? Well, it’s not! The ice shelves are actually pretty well protected from this warm subsurface water…
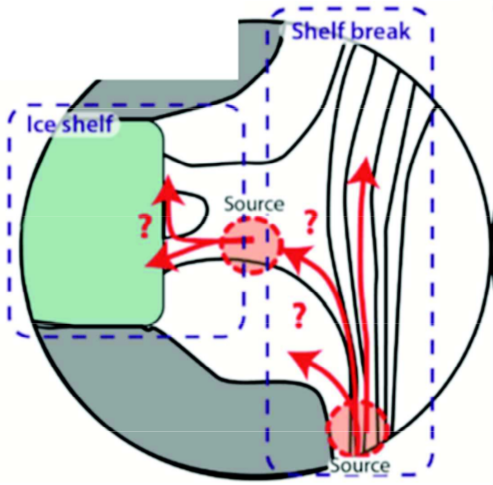
In Figure 5 from our post on Tuesday you can see that especially the largest ice shelves—Filchner-Ronne and Ross Ice Shelves—are protected from warm water through the continental shelves that keep the warm water at a distance of several hundreds of kilometers. Oceanic currents tend to flow along the bathymetry (slopes), not across it. The continental slope—the steep slope connecting the deep Southern Ocean to the continental shelf— thus acts like a wall and limits the flow of warm water onto the shelf. In the Amundsen and Bellinghausen Sea, however, the warm water already reaches on the continental shelf, and it reaches all the way to the ice shelf front. The ice shelf front reaches many hundreds of meter down into the water, and it forms a second wall that the water has to cross in order to reach the cavities beneath the ice shelves. The pathway of the warm water across these two walls, or topographic barriers as we like to call them, is still poorly understood and therefore the main focus of our project. How does the warm water that is located outside the continental shelf and in a depth of hundreds of meters flow onto the continental shelf and beneath the ice shelf?
Figure 7. Sketch for the project TOBACO of the uncertainties in the warm water flow across the shelf break and the ice shelf front.
Topographic steering
The rotation of the Earth causes ocean currents flow parallel to topographic slopes, i.e. to roughly follow lines of constant depth. The currents around Antarctica therefore follow the continental slope, and water from the slope doesn’t easily make it onto the continental shelf. Similarly, at an ice shelf front currents mainly flow parallel to the front instead of entering the ice shelf cavity. The shelf break and the ice shelf front form a topographic barrier
Warm water has been measured on the continental shelf and beneath ice shelves. In fact, the water can cross topographic barriers after all!
Certain processes help the warm Circumpolar Deep Water to cross the barriers:
Troughs crosscutting the continental shelf and the shelf break reduce the barrier effect and enable on-shelf transport.
Eddies formed within the currents are able to move across the “barriers” bringing (warm) water with them.
During our time at the Coriolis platform, we will investigate these points by varying the trough geometries, current thickness and density. If you are interested, please follow our blog throughout the experiments and learn about the control of topography on ocean currents and ice shelf melt!
The Antarctic Ice Sheet is melting because it is losing more mass through increased air and ocean temperatures than it gains mass by snow fall. Melting of ice is most efficient through contact with water, because water has a higher heat conductivity compared to air; simply said this means that water removes heat easier from the ice than air. In case of the Antarctic Ice Sheet it is also of importance that air temperatures are mainly far below the freezing point, whereas the ocean is always warmer than or close to the freezing point. The strongest melting in Antarctica therefore occurs beneath ice shelves. You want to know more about the melting process and what happens beneath an ice shelf?
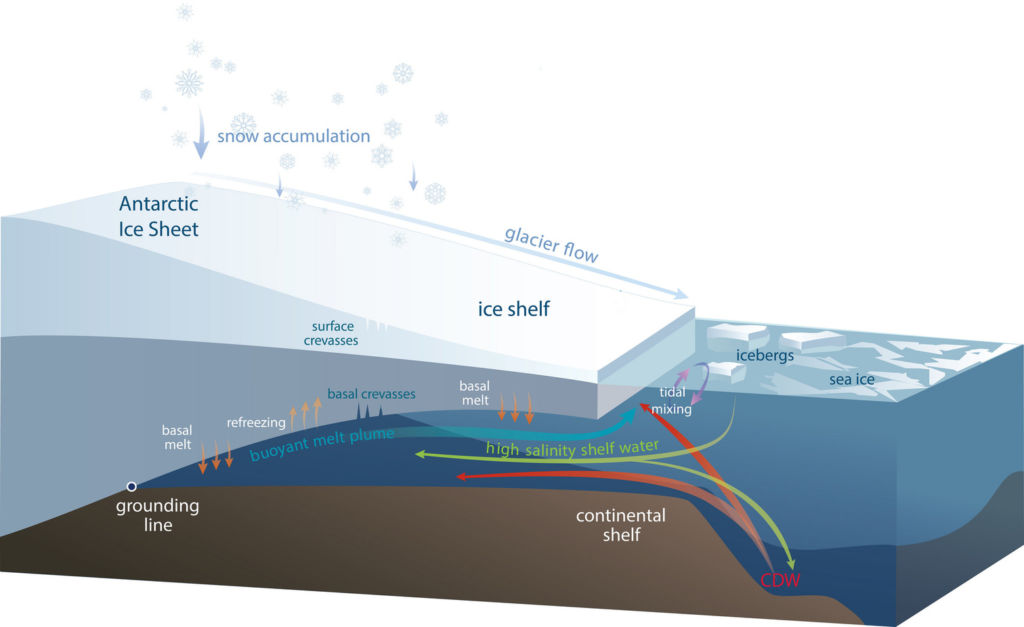
The ice pump beneath ice shelves
Ice shelves are melting from beneath as ocean water reaches into the cavity. To explain the processes, we come back to the sketch of an ice shelf that we already showed you before.
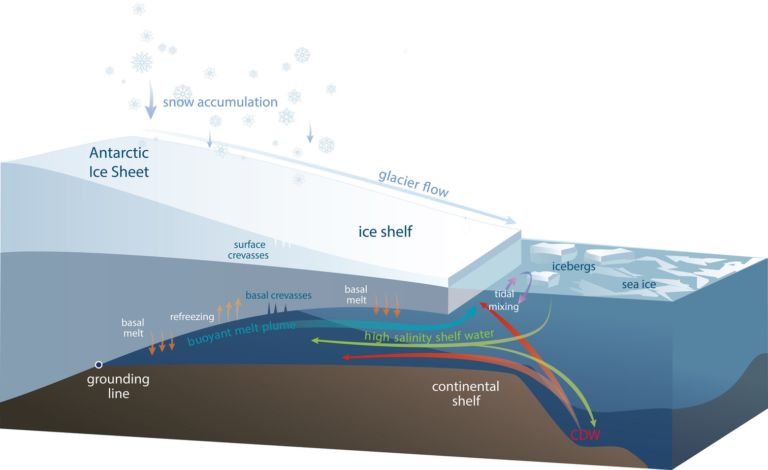
In front of ice shelves the ocean freezes to sea ice, which is a process that produces very saline and dense water (high salinity shelf water). Because of its high density, it sinks down and mixes with circumpolar deep water (CDW) that spills over the continental shelf edge. The water mixture is then relatively dense and warm. It flows along the bottom of the continental shelf that is—in many cases—deepening inland and therefore reaches far beneath the ice shelf. When the water reaches to the ice shelf base it is far below sea level and at a higher pressure. Water there can still be liquid at temperatures down to below -2⁰C! And the ice starts melting as soon as the temperatures reach above this pressure melting point! If the ocean water is warmer than this temperature, it melts the ice shelf from below. The melt water is fresh with a low density and brings water out of the ice shelf cavity in form of a buoyant melt plume. All together, this forms an ocean circulation beneath the ice shelf, called ice pump.
Figure 4. This sketch shows a typical Antarctic ice shelf that starts floating from the grounding line and enables the flow of warm circumpolar deep water (CDW) underneath the ice shelf. The ice therefore melts from below (basal melt) and this melt water rises as a buoyant melt plume. Image credit: Helen Amanda Fricker, Professor, Scripps Institution of Oceanography, UC San Diego.
Where does the warm water come from?
The rates at which all Antarctic ice shelves melt from beneath are estimated to be about 1325 Gt/yr (gigatons per year; or 3.7 mm sea level equivalent per year). Yes, this is a lot! We are wondering where all the energy comes from and how the warm water reaches onto the continental shelf…
The dynamics governing the flow of warm water towards and underneath the ice shelves are non-trivial and still poorly understood. However, we know that the heat reservoir threatening the ice shelves is located off the continental shelf, in the deep Southern Ocean, where relatively warm water resides below a shallow, cold and fresh surface layer. Well, you may wonder how cold water can float on top of warm water!? If you have ever been swimming in a lake or in the ocean, you may have realized that it usually gets colder the further down you get.
Water layers in the oceans are stratified due to their different densities, with the densest water masses lying at the bottom of the sea floor and the lightest water masses floating at the surface. Density is given by the salt content and the temperature: high salinity and low temperatures lead to the densest water masses. In the tropics, the temperature is more important and it usually gets colder with depth. Closer to the poles, however, salinity gets more important. In the Southern Ocean, the warmer water can stay beneath the cold and fresh surface layer, because of its high salt concentration. The warm subsurface water it transported with the Antarctic slope current, which flows westwards along the Antarctic slope almost around the whole Antarctic continent.
West Antarctic threatened by a warm ocean
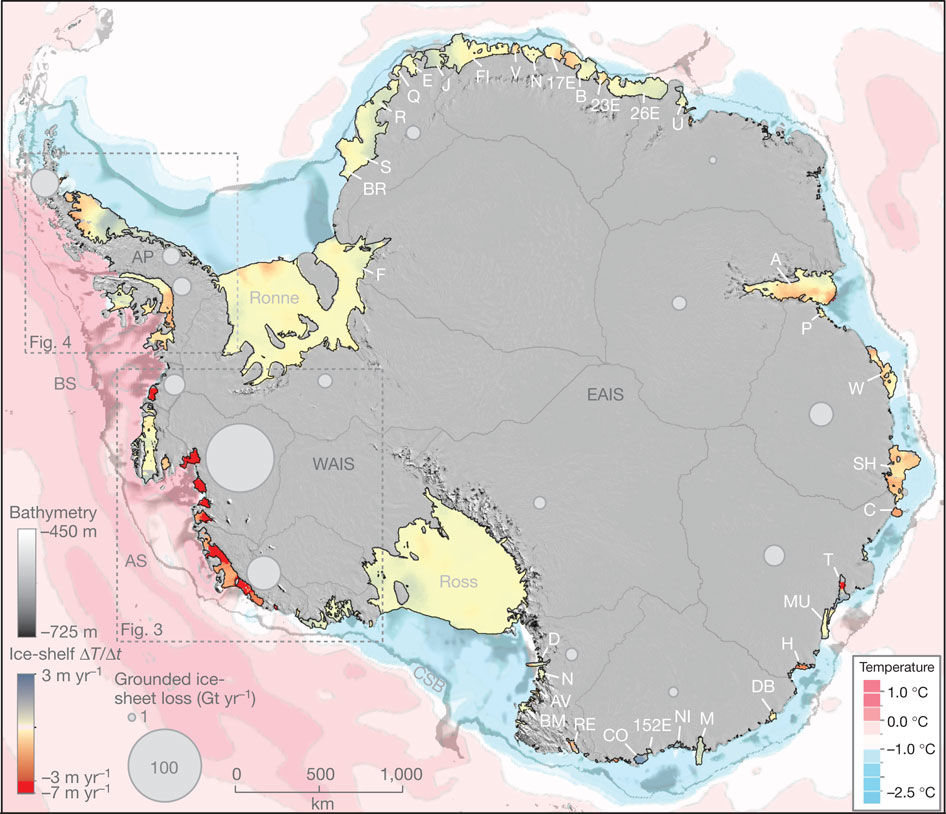
In West Antarctic, especially in the Amundsen and the Bellinghausen Sea, the water found on the continental shelf is relatively warm compared to East Antarctic (Figure 5), resulting in high melt at the base of the ice shelves. Some of the ice shelves therefore thin tens of meters per decade! This thinning also expands upstream to the proximal grounded glaciers which then causes a sea level rise. The figure shows that already today one drainage area in West Antarctica alone lost almost 100 Gt/yr to the ocean, with a trend towards increasing numbers due to basal malt. These basal melt rates are challenging to estimate, which makes the contribution of West Antarctic Ice Sheet melt to sea level rise to the largest source of uncertainty in the fifth assessment report of the Intergovernmental Panel on Climate Change (IPCC).
Figure 5. Water temperatures of the Southern Ocean around the Antarctic Ice Shelf and the resulting ice shelf thickness change per year, as well as the ice loss from the grounded ice sheet that actually contributed to sea level rise (circles) (Pritchard et al., 2012).
West Antarctic – A marine ice sheet
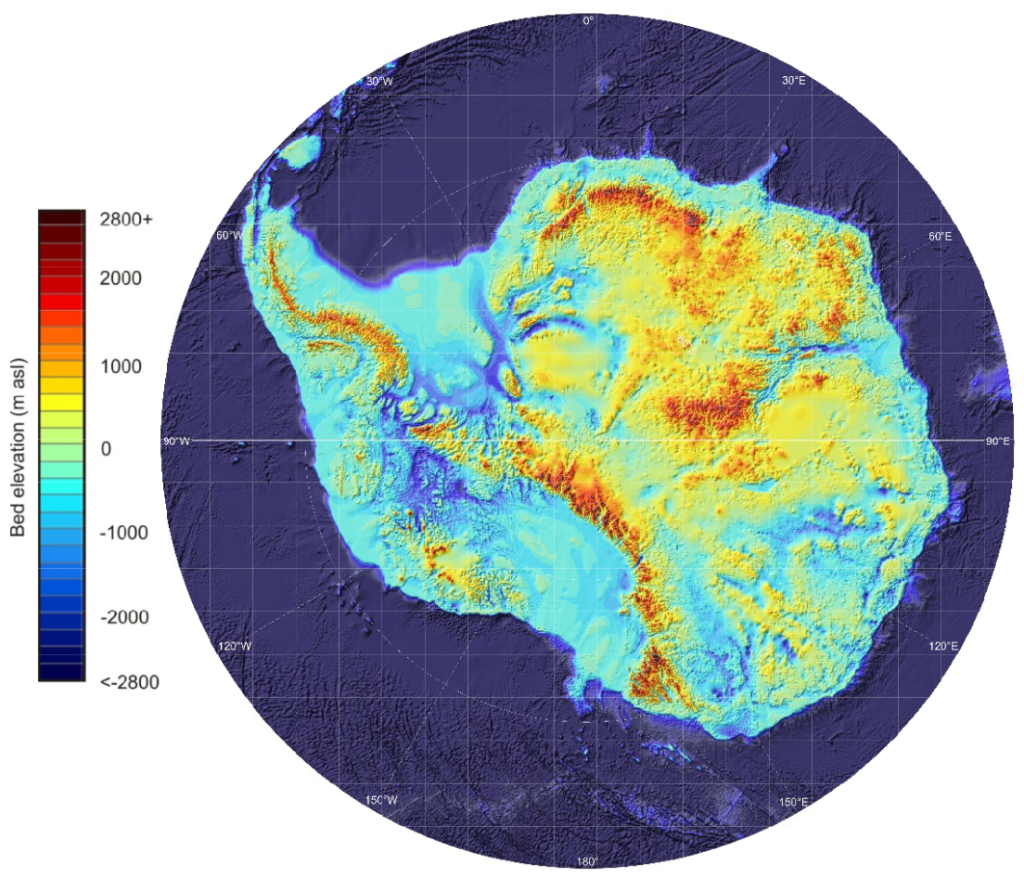
Besides the ocean temperatures, there is another substantial difference between West and East Antarctica that leads to the high mass loss in the former one: The bedrock beneath the West Antarctic Ice Sheet lies far below sea level (up to more than 1 km) in most parts (the blue areas in Figure 6). Thus, most of the ice sheet’s base is located far below sea level, what we call a marine ice sheet. Marine ice sheets are particularly instable for several reasons:
Their bed slopes inland, which generally is an instable configuration. As submarine melt moves the grounding line—the transition zone between grounded and floating ice—further inland, it reaches into deeper areas, that make the glacier floating again and also causes a larger flux through the grounding line. Once this process is triggered, the glacier retreats continuously until the bed geometry changes again.
The pressure melting point—the temperature at which ice freezes or melts—is reduced when the pressure increases. When the glacier base reaches into deeper waters where the pressure is higher, the melting point therefore decreases and the surrounding water is warm relative to the melting point. It may be warm enough to melt the ice from below.
The uncertainty regarding the West Antarctic Ice Sheet melt to sea level rise therefore results from the exposure of the ice sheet to relatively warm water. The ice sheet is also close to a tipping point at which the ice sheet may irreversibly lose large amounts of ice. To better estimate future sea level rise, we need a good estimate on the ocean heat flux to the ice shelves and good knowledge on the response of the ice sheet.
Figure 6. The bed topography beneath the Antarctic Ice Sheets reveals that most parts of West Antarctica lie beneath sea level, which makes the West Antarctic Ice Sheet sensitive to ocean warming (Fretwell et al., 2013)
Are you exited about our experiments at the Coriolis platform? We can’t await to finally getting started with the experiments! To shorten the waiting time, we would like to introduce you into the topic of our research throughout the next three days, so that it will be easier for your to follow up on the happening in Grenoble. Today, we will introduce to the Antarctic Ice Sheet and its fringing ice shelves…
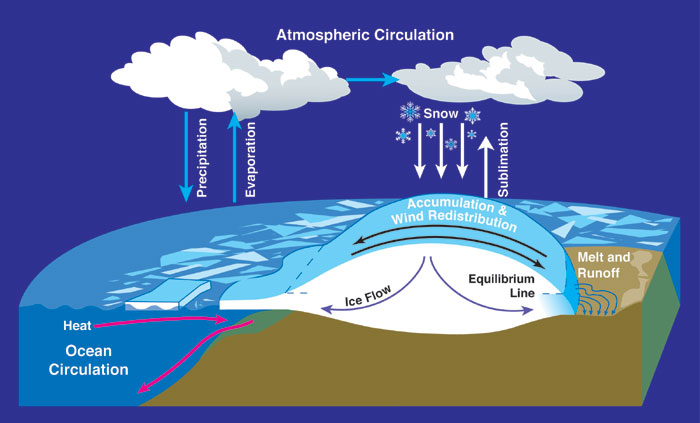
The Antarctic Ice Sheet and sea level rise
The Antarctic Ice Sheet contains 26.5 Mio km³ of ice. Such a big number is difficult to grasp, but it is 70% of the Earth’s freshwater and equals—if the ice is completely melted—a sea level rise by 58 m. Luckily melting of an ice sheet is a slow process which is compensated by the accumulation of snow as shown in the sketch below. However, this compensation got out of balance during the last two decades and we know from satellite observations that the Antarctic Ice Sheet is losing more mass to the ocean than it gains by snow fall. In average, it lost about 310 +- 74 km³ (or 0,78 mm of sea level rise) per year during 2003-2012; especially in West Antarctic this mass loss has accelerated so that the area has already lost 70 % more ice compared to a decade ago (Paolo 2015).
Figure 1. Here is a sketch of the Antarctic Ice Sheet and its interaction with the atmosphere and the ocean. Ice forms through the accumulation of snow and slowly flows to the sides due to its own weight. When it reaches lower elevations, it melts by warm air temperatures or by the ocean where it ends in ice shelves—the floating extension of an ice sheet—as seen on the left side of the figure. Source: NASA. From Wikipedia Commons.
Ice shelves are important!
Most of Antarctica’s periphery (75%) is buttressed by ice shelves—the floating extension of an ice sheet. Ice shelves occur, where the ice is thin and the bed rock far enough below sea level that the ice gets lifted off the underlying bedrock. As soon as the ice is detached from the bed, ocean water can penetrate beneath it and start melting as shown in the sketch below.
Figure 2. This sketch shows a typical Antarctic ice shelf that starts floating from the grounding line and enables the flow of warm circumpolar deep water (CDW) underneath the ice shelf. The ice therefore melts from below (basal melt) and this melt water rises as a buoyant melt plume. Image credit: Helen Amanda Fricker, Professor, Scripps Institution of Oceanography, UC San Diego.
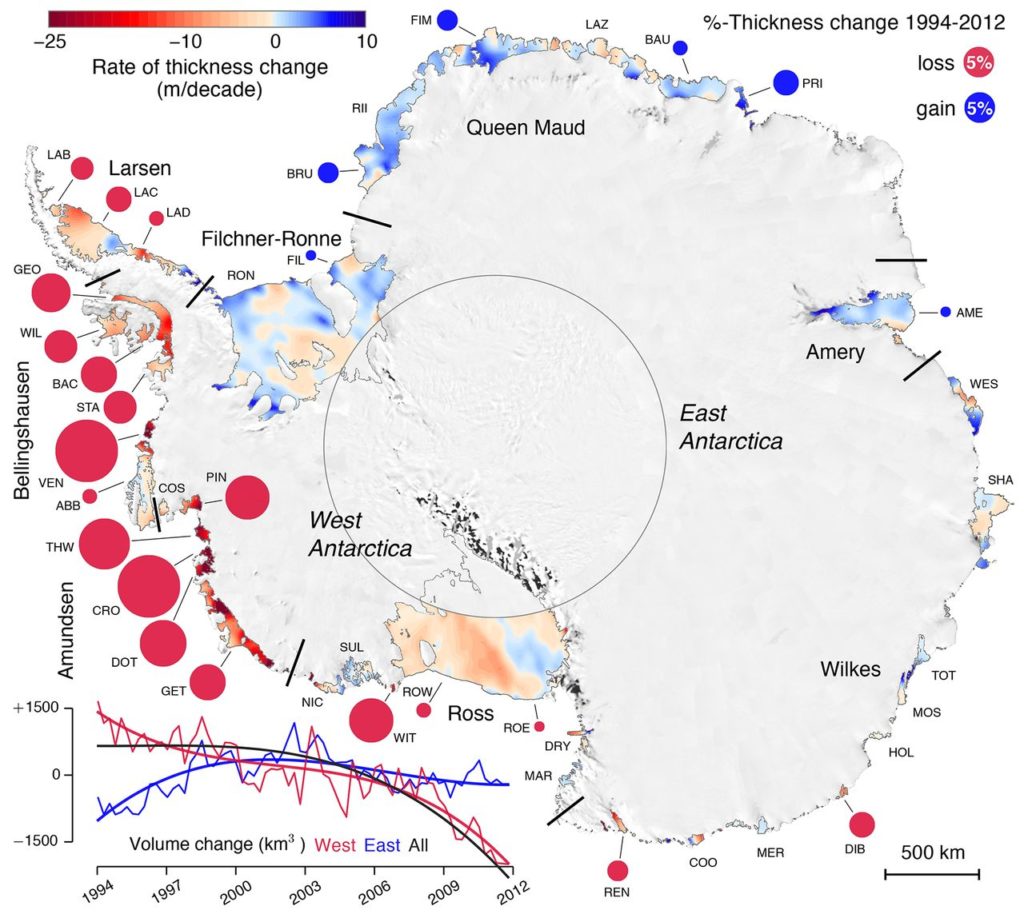
The total area of all Antarctica’s ice shelves is almost as large as the whole Greenland Ice Sheet and cover about 11% of Antarctica’s area. In other words, 11 % of the Antarctic Ice Sheet is floating! Figure 3 shows the Antarctic Ice Sheet where all ice shelves are shown in color. The colors correspond to their thickness change: red indicates strong thinning, blue indicates slight thickening. The circles associated with the different ice shelves show the percentage of thickness change.
Figure 3. Observed thickness changes of all ice sheets around the Antarctic Ice Sheet with colors showing the absolute change per decade and circles showing the relative change between 1994 and 2012. The total volume change of the Antarctic Ice Sheet, West Antarctic and East Antarctic are shown in the lower left corner. Source: Paolo et al., 2015.
Now you may think that there is a lot of blue color, so thickening of the ice shelves. It’s not so bad after all?! Only looking at the eastern part you are totally right! Many ice shelves have actually been thickening since 1994, which means they were growing! However, the largest mass change is happening in West Antarctic, where the colors are reddest and the circles largest. The small time line in the lower left corner compares the volume change of East Antarctica (blue) with West Antarctica (red). The western part has been losing mass since 1994, whereas the eastern part actually gained mass in the beginning until also the eastern part started losing mass in 2003. The black line is the total mass loss and you see that the volume went down continuously since 2003—so, West Antarctica wins in the end!
When talking about thinning of ice shelves, we always have to keep in mind that ice is almost as heavy as water; 9/10th of an ice shelf is therefore floating below the sea surface. This means that they are already part of the ocean and do not contribute much to sea level rise when they melt. But still, their role is to buttress the ice that is drained through ice streams—slow rivers of ice—from the interior towards the ocean. Thinning will therefore accelerate the ice flow further upstream in the grounded part and increase the ice sheet’s contribution to sea-level rise by acceleration and increased mass loss.