
Oceanographers like me often talk about «water masses», that is water with different origin that therefore has different salinity and temperature. We talk about “Atlantic water”, which is warm and salty, about Antarctic surface water which is fresh and col or about Antarctic shelf water which is cold and salty. The salinity and temperature of the water will determine its density; cold water is denser than warm water, fresh water is lighter than saline water.
The properties of the water masses are to a large extent set by the atmosphere. Where it is warm, the water is heated up and where it is cold the water is cooled down. The salinity is determined by evaporation, freshwater input (from rivers or precipitation) and by the formation of sea ice. When ice is formed during the winter, it is the water molecules that freeze. Most of the salt is rejected, and the salinity in the water below the ice thus increases. In shallow areas where a lot of ice is formed – for example in some parts of the continental shelf surrounding Antarctica – the water can become very saline and hence very dense.
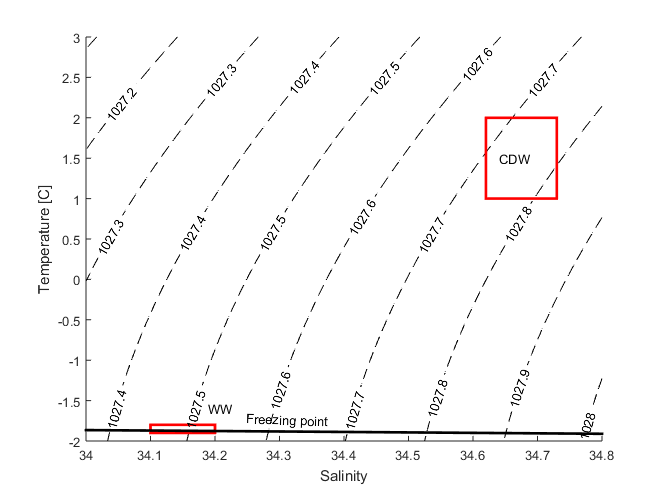
The exercise below is about Circumpolar Deep Water, CDW. CDW is actually a mixture of several water masses, amongst other water that orinates as far away as the North Atlantic. CDW has a temperature between 1-2 degrees and a salinity between 34.62 and 34.73. Strangely enough, salinity does not have any unit, but is approximately permil so if the salinity is 1 there is about 1 gram of salt per kilo water. The salinity in the ocean is typically about 35, or 3.5%.
In a TS-diagram (a graph with salinity on one axis and temperature on the other axis, see below) a water mass is a point or a small box – if we mix two water masses the mixture will lie on a straight line between the two water masses.
Exercise 1
You have two bottles A and B where \(S_A\)=33.2, \(T_A\)=4C and \(S_B\)=34.8, \(T_B\)=1C. Mark them in a TS-diagram
- What is the salinity and temperature of a mixture that is made of 50% A and 50% B?
- What is the salinity and temperature of a mixture that is made of 10% A and 90 % B?
- What is the salinity and temperature of a mixture that is made of 73% A and 27% B?
- Plot your mixtures in the TS-diagram. What do you see?
- If you have a third water mass \(S_C\)=33.7, \(T_A\)=0C – which mixtures can you get then?
Exercise 2
Import and plot salinity and temperature from the mooring S4, 320 m depth as a function of time (the file is named ENG_Riggdata_S4_TS).
- Time is given as days since 1 january, 2012. What day was the mooring deployed? Recovered?
- What is the average temperature /salinity and standard deviation?
- Is there a seasonal signal? Can you describe it with a sinus function? Why / why not?
- Plot temperature versus salinity in a TS-diagram – what do you see? Can you describe the relationship between salinity and temperature with a linear regression?
- An instrument in the vicinity of the mooring measured S=34.25, S=34.6 and S=33.9. What do you think the temperature was?
- Are your answers to the exercise above reasonable? Sea water freezes at -1.9C. For what salinities are your regression valid?
- The observations show that the mooring is surrounded by a mixture of CDW (Circumpolar Deep Water) and WW (Winter Water). What are the salinity/temperature of our CDW? WW normally has a temperature of -1.9C. Do we observe pure WW at our mooring? Use your regression to determine the salinity of the WW.
- You now have determined the properties (S and T) of WW and CDW. What is the temperature and salinity in a mixtruer of 10% CDW and 90%WW? 75% CDW abd 25% WW?
- What would be the termeprature of water with a salinity of 34.45? What fraction of the water is CDW?
Exercise 3
The density of seawater depends on its salinity and temperature. Cold water is denser than warm fresh water is lighter than saline water. The relationship between S, T and density is complicated, but for small changes in salinity and temperature the relationship is approximately linear.
\( \rho = \rho_0 [1 + \beta (S – S_0) – \alpha (T – T_0) ] \)In the expression above \(S\) is salinity, \(T\) is temperature, \(\beta\) is the haline coefficient and \(\alpha\) is the thermal coefficient. \(S_0\) och \(T_0\) are reference values that you can choose freely and \(\rho_0=\rho(S_0,T_0)\). The values of \(\alpha\) and \(\beta\) depends on what values you chopse forr \(S_0\) and \(T_0\). If we chose \(S_0\)=34.6 and \(T_0=\)=0.5C then \(\rho_0=\rho(S_0,T_0)\)=1027,8 kg/m\(^3\), \(\alpha \approx \) 5.77*10\(^{-5}\) C\(^{-1}\) and \(\beta \approx 7.84*10^{-4}\).
Use the linearisation to calculate density profiles based on the temperature and salinity profiles from the Amundsen Sea (file ENG_CTDdata_Amundsenhavet). What do they look like compared with the salinity and temperature profiles?
- Chose one of the profiles? Where is the density largest? Smallest? Why is it like that?
- How big is the density difference between the bottom and the surface? How much more saline must the water in the surface be to be as dene as the water at the bottom?
- The density must increase with depth, otherwise the water column I unstable: dense water is lying on top of light water. The dense water then will sink down to “its” level (this is called convection)
- If we cool down the water in the surface to the freezing point (-1.9C), what will happen?
Strong wind can mix the upper layer so that we get a homogenous layer (constant salinity and temperature). The salinity is then equal to the mean salinity.
- What is the mean salinity of the upper 100 m?
- How heavy would the homogenous surface layer be if it was cooled down to the freezing point (-1.9C)
- By how much do we have to increase the salinity for the water in the surface to be as heavy as the water at the bottom? (How can this happen in Antarctica? In the Mediterranean Sea?)
Exercise 4
When the temperature increase the density decrease – that means that1 kg of warm water occupies a larger space than 1 kg of cold water. A large part of the sea level rise that we are observing today (and that we will see in the future) is caused by the increase in temperature of water at depth in the ocean. If water which is 4000m deep (with \(S_0\), \(T_0\), \(\rho_0\),\(\beta\) and \(\alpha\) as given in exercise 3) is heated by 1C, how much will the sea level then rise?
Exercise 5
It is the water molecules that forms crystals when sea water freezes – the salt is rejected by the growing ice and mixes with the sea water below. The salinity* of freshely frozen ice is typically 7-10**. Since the salinity has such a large influence on the density, we want to find out how much the salinity in the water increases (\(\Delta S\)) when ice of a certain thickness (\(h_{ice}\)) and salinity (\(S_{ice}\)) is formed. We can do that using the formula:
\(\Delta S= \frac{h_{ice}(S-S_{ice})}{H_{water}}\) where \(H_{water}\) is the thickness of the layer that the salt mixes into.
- By how much does the salinity increase of we freeze (i) 10 cm (ii) 1 m of ice over a 100 m thick layer where S=34.5 and \(S_{ice}\) =7?
- By how much does the salinity increase of we freeze (i) 10 cm (ii) 1 m of ice over a 1000 m thick layer where S=34.5 and \(S_{ice}\) =7?
- By how much does the density increase in a-b? (Set T=T\(_f\) (See exercize 3).
- How much ice do we have to freeze for the water in 3h to be as heavy as the water on the bottom? (Let H=100 m, the thickness of the layer that the storm mixed) Is that realistic?
*You determine the salinity of ice by melting it down and measureing the salinity of the melt water.
**For old ice in the Arctic the salinity can be almost zero!