
The ice shelves in the Amundsen Sea are melting relatively quickly since warm water is entering the cavity beneath the ice. We thus want to know how much heat the water on the continental shelf contains, and how much heat that is entering the ice shelf cavity. The heat content is given relative to a reference temeprature \(T_{ref}\). What you calculate, is how much heat you have to remove before the temperature of the water is \(T_{ref}\). If you have to add heat for the water to reach \(T_{ref}\), then the heat content is negative.
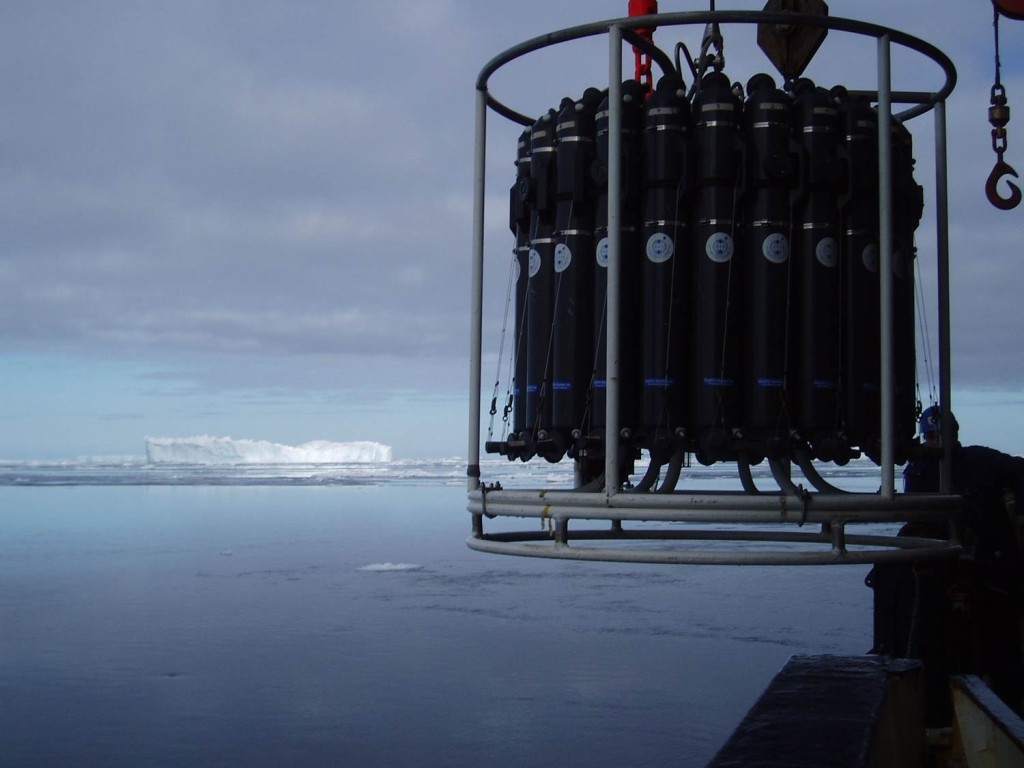
We can find the heat content \(H\) in the water from a CTD-profile (observations of temperature, and salinity from the surface to the bottom):
\(H\approx\sum_{z=1}^{depth}\rho c_p \left(T(z)-T_{ref}\right)\Delta z\)\(\rho\) is the density of the water (about 1027 kg/m\(^3\) and \(c_p=4\times10^3\)J/kg/C is its heat capacity.
You are free to choose the reference temperature – but since sea water freezes and -1.9C it is practical to choose \(T_{ref}\)=-1.9C. The heat content is then the energy one can remove from the water before it freezes. \(H\) is the heat conent per square meter.
When warm water is in contact with ice the heat will be used to melt ice. To melt a kilo of ice you need approximately 330 kJ (or a bit more if the ice is cold).
Exercise 1
- Import the data from the CTD-profiles from the Amundsen Sea (you’ll find them one after each other in the file ENG_CTDdata_Amundsenhavet in Geogebra. Plot a few of the profiles and calculated the heat content
- How much of the heat is found in the upper 200 m? below 200 m depth?
- We are mostly interested in the heat at depth. Do you know why?
- Make a table where you note the heat content (in the upper and lower layer separately) and the temperature at the bottom. (You may well cooperate in groups!)
- My colleagues argue that there is a direct relationship between the bottom temperature and the heat content, so that all we’d need to measure is the temperature at the bottom. What does it look like in your data? Can you draw a conclusion based on the data at hand? Discuss!
If you want to add more points to your table, you can download data from the entire cruise in 2010 from NODC, a large data bank where we scientist send our data so that other researchers (and you!) can use them!
Exercise 2
- How much ice (per square meter) can we melt with the heat from the profiles above?
- The melt below the ice shelf in the Amundsen Sea is about 400 Gton per year. How much heat is that?
Exercise 3
- If the West Antarctic Ice sheet were to collapse, the sea level would increase with three meters – how many cubic meters of ice does that correspond to?
- How much heat is needed to melt that ice? (Does it have to melt for the sea level to rice?)
- A wind turbine typically produce 2 MW – how long time would it take for the wind turbine to produce the energy needed to melt the ice?
- The earth receives about 0.5 W/m\(^2\) more energy (through radiation) from the sun than what is given off – how long time would it take to melt the ice if all of the energy was used to melt ice?
- A Norwegian uses about 30 000 kWh per person per year –how many cubic meters of melted ice does that correspond to?
[slr-infobox]
Radius of the Earth: 6371 km
Density, ice: 900 kg/m\(^3\)
Density, snow: 900 kg/m\(^3\)
Density, sea water: 1027 kg/m\(^3\)
Percentage of the Earth that is water: 70%
[/slr-infobox]